配色(Color、Colormap、Palette)与颜色条(Colorbar)
Choosing color palettes — seaborn 0.13.2 documentation
| 导入模块 | |
|---|---|
基本概念
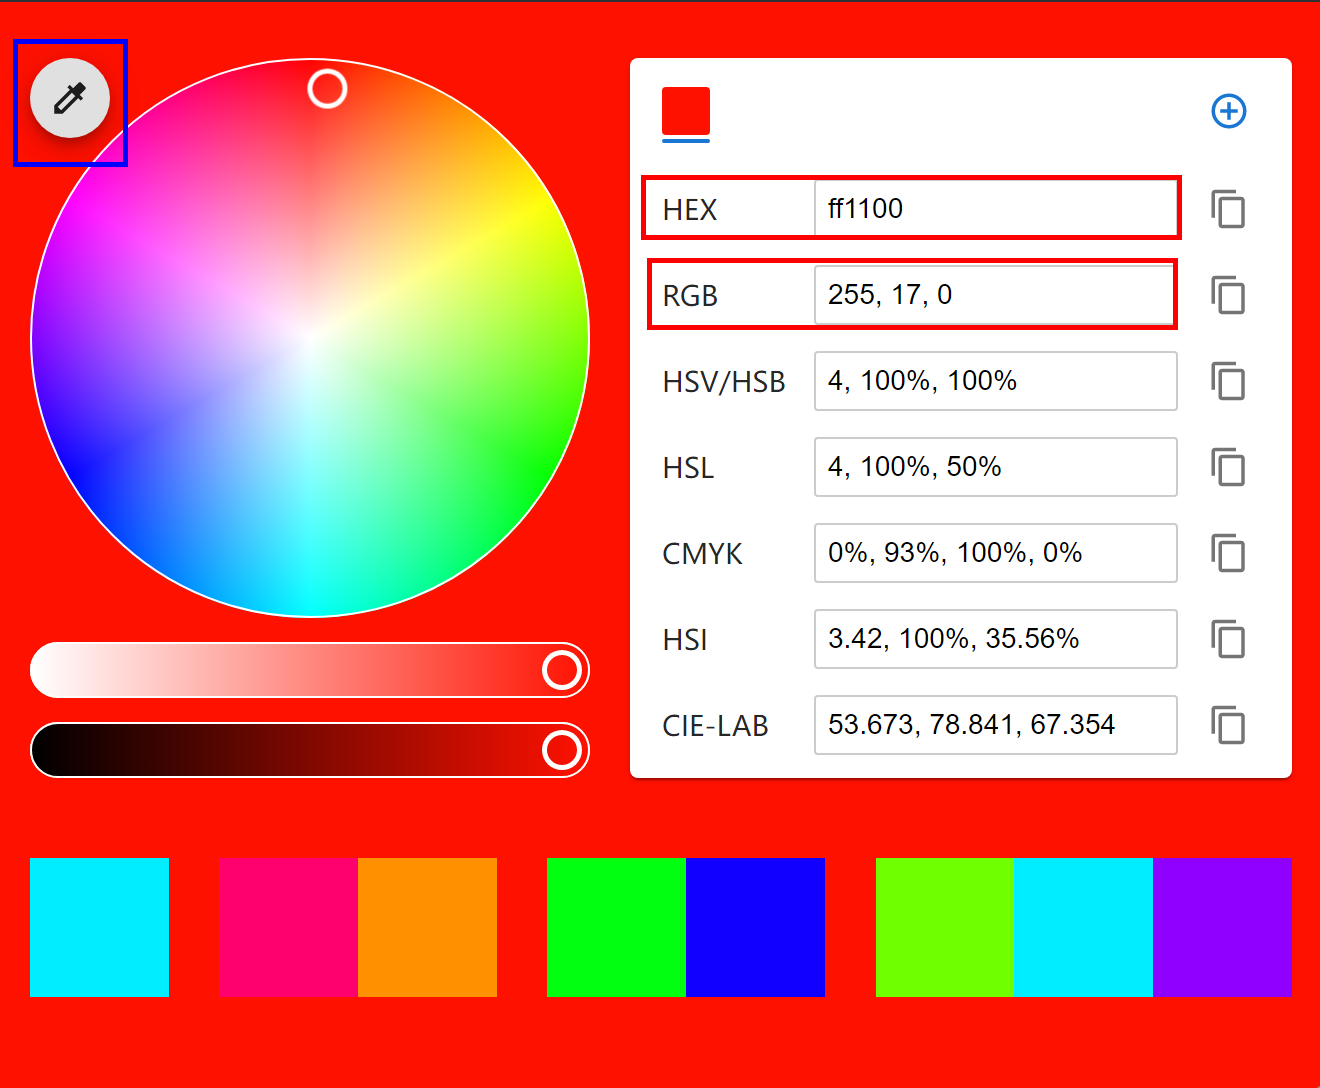
基于人眼工作方式,可以使用三个组分来定义特定的颜色。通常通过指定它们的 RGB值 来在计算机中编程颜色,这些值设置显示中红色、绿色和蓝色通道的强度。但为了分析颜色的感知属性,最好从色调(h)、饱和度(s)和亮度(l)通道的角度来考虑。
色调(Hue)
色调是区分“不同颜色”的非技术性组成部分。它是导致“红色”和“蓝色”等一级名称的颜色属性。一般使用色调变化来表示不同类别,但色调变化不适合表示数值数据。

饱和度(Saturation)或色度(chroma)
饱和度(或色度)是色彩的鲜艳度。两种不同色调的颜色在饱和度更高时看起来会更加明显。

亮度(Lightness)
亮度和发出的(或反射的,对于印刷颜色)光量相对应,范围从黑色到白色。调整亮度有助于在数据中看到结构,亮度变化更直观地被视为重要性变化,细微的色调变化增加了两个值之间的感知距离。

单颜色(color)
Specifying colors — Matplotlib 3.10.0 documentation
通用源格式
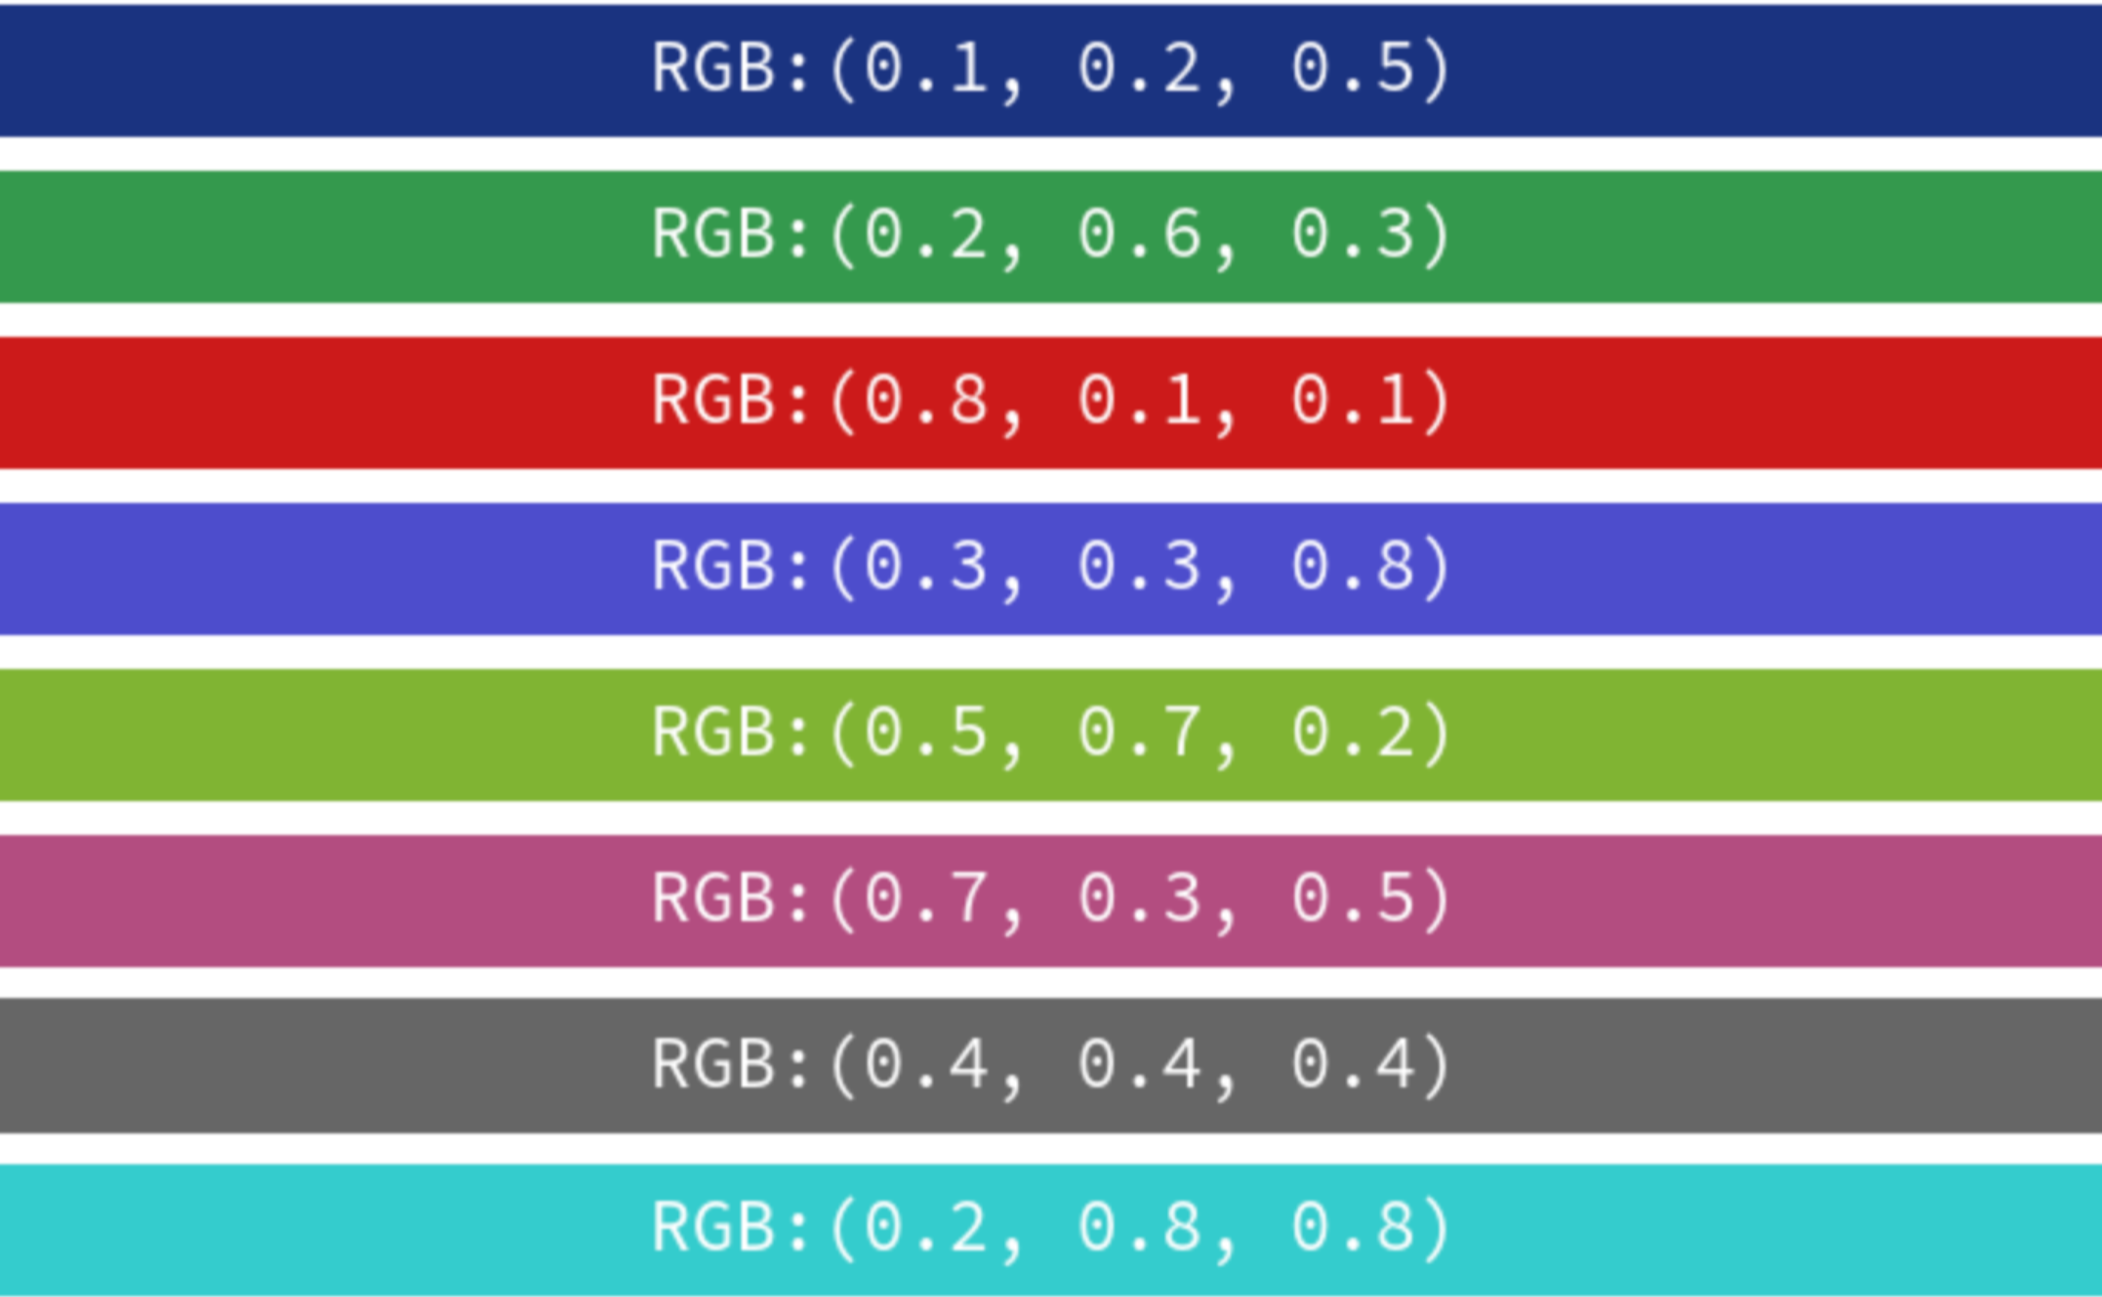
(R, G, B)格式
元组中浮点型数值位于[0, 1]之间(相对于[0, 255]),括号中数值依次表示Red, Green 和 Blue。
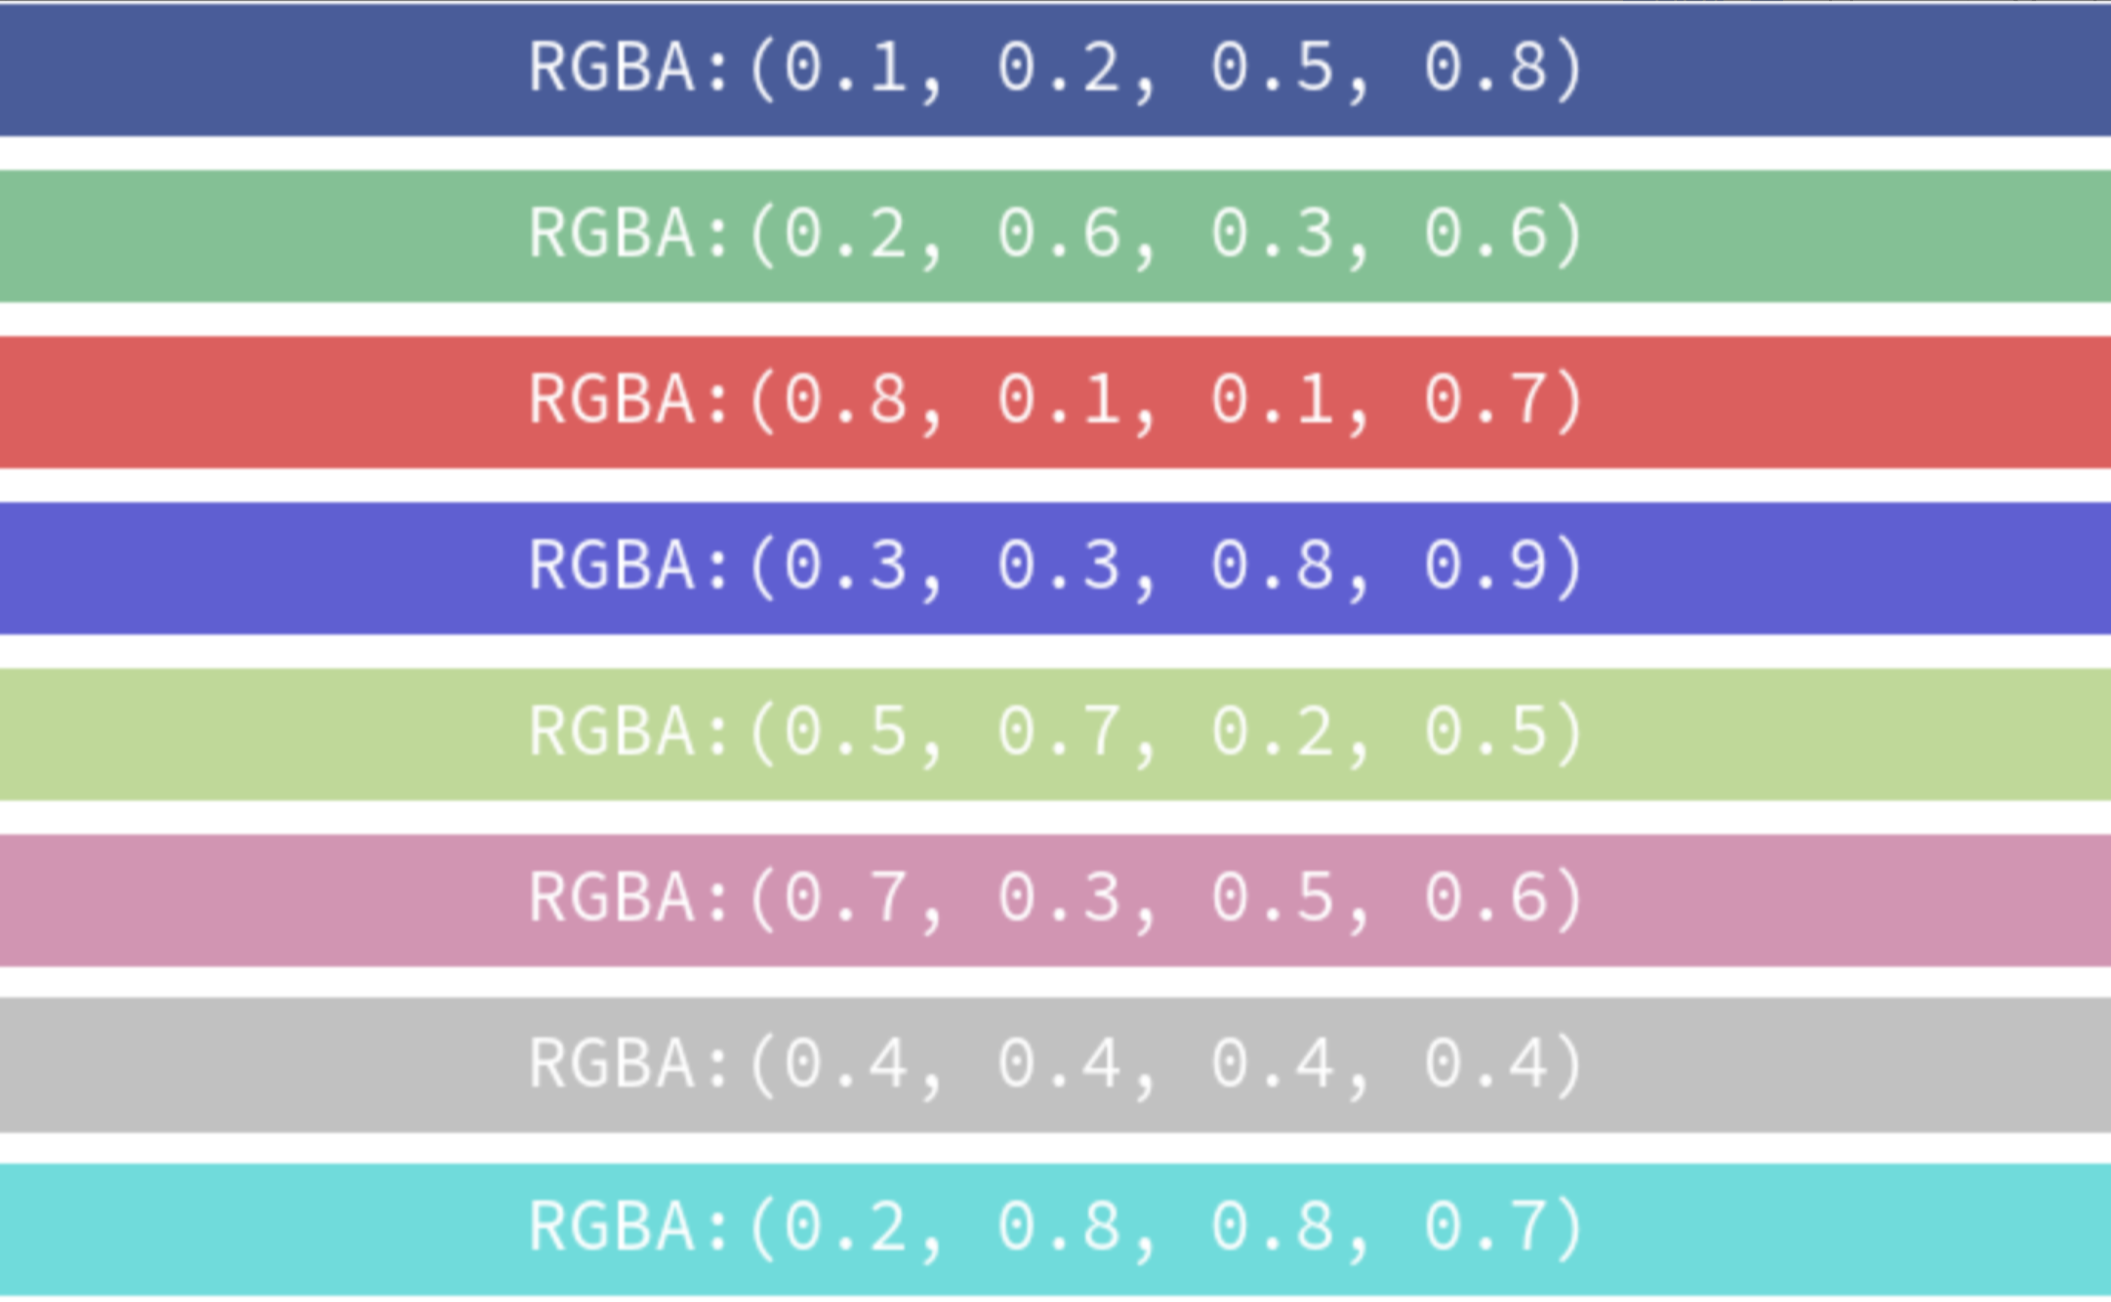
(R, G, B, A)格式
元组中浮点型数值位于[0, 1]之间(相对于[0, 255]),括号中数值依次表示Red, Green, Blue 和 Alpha。
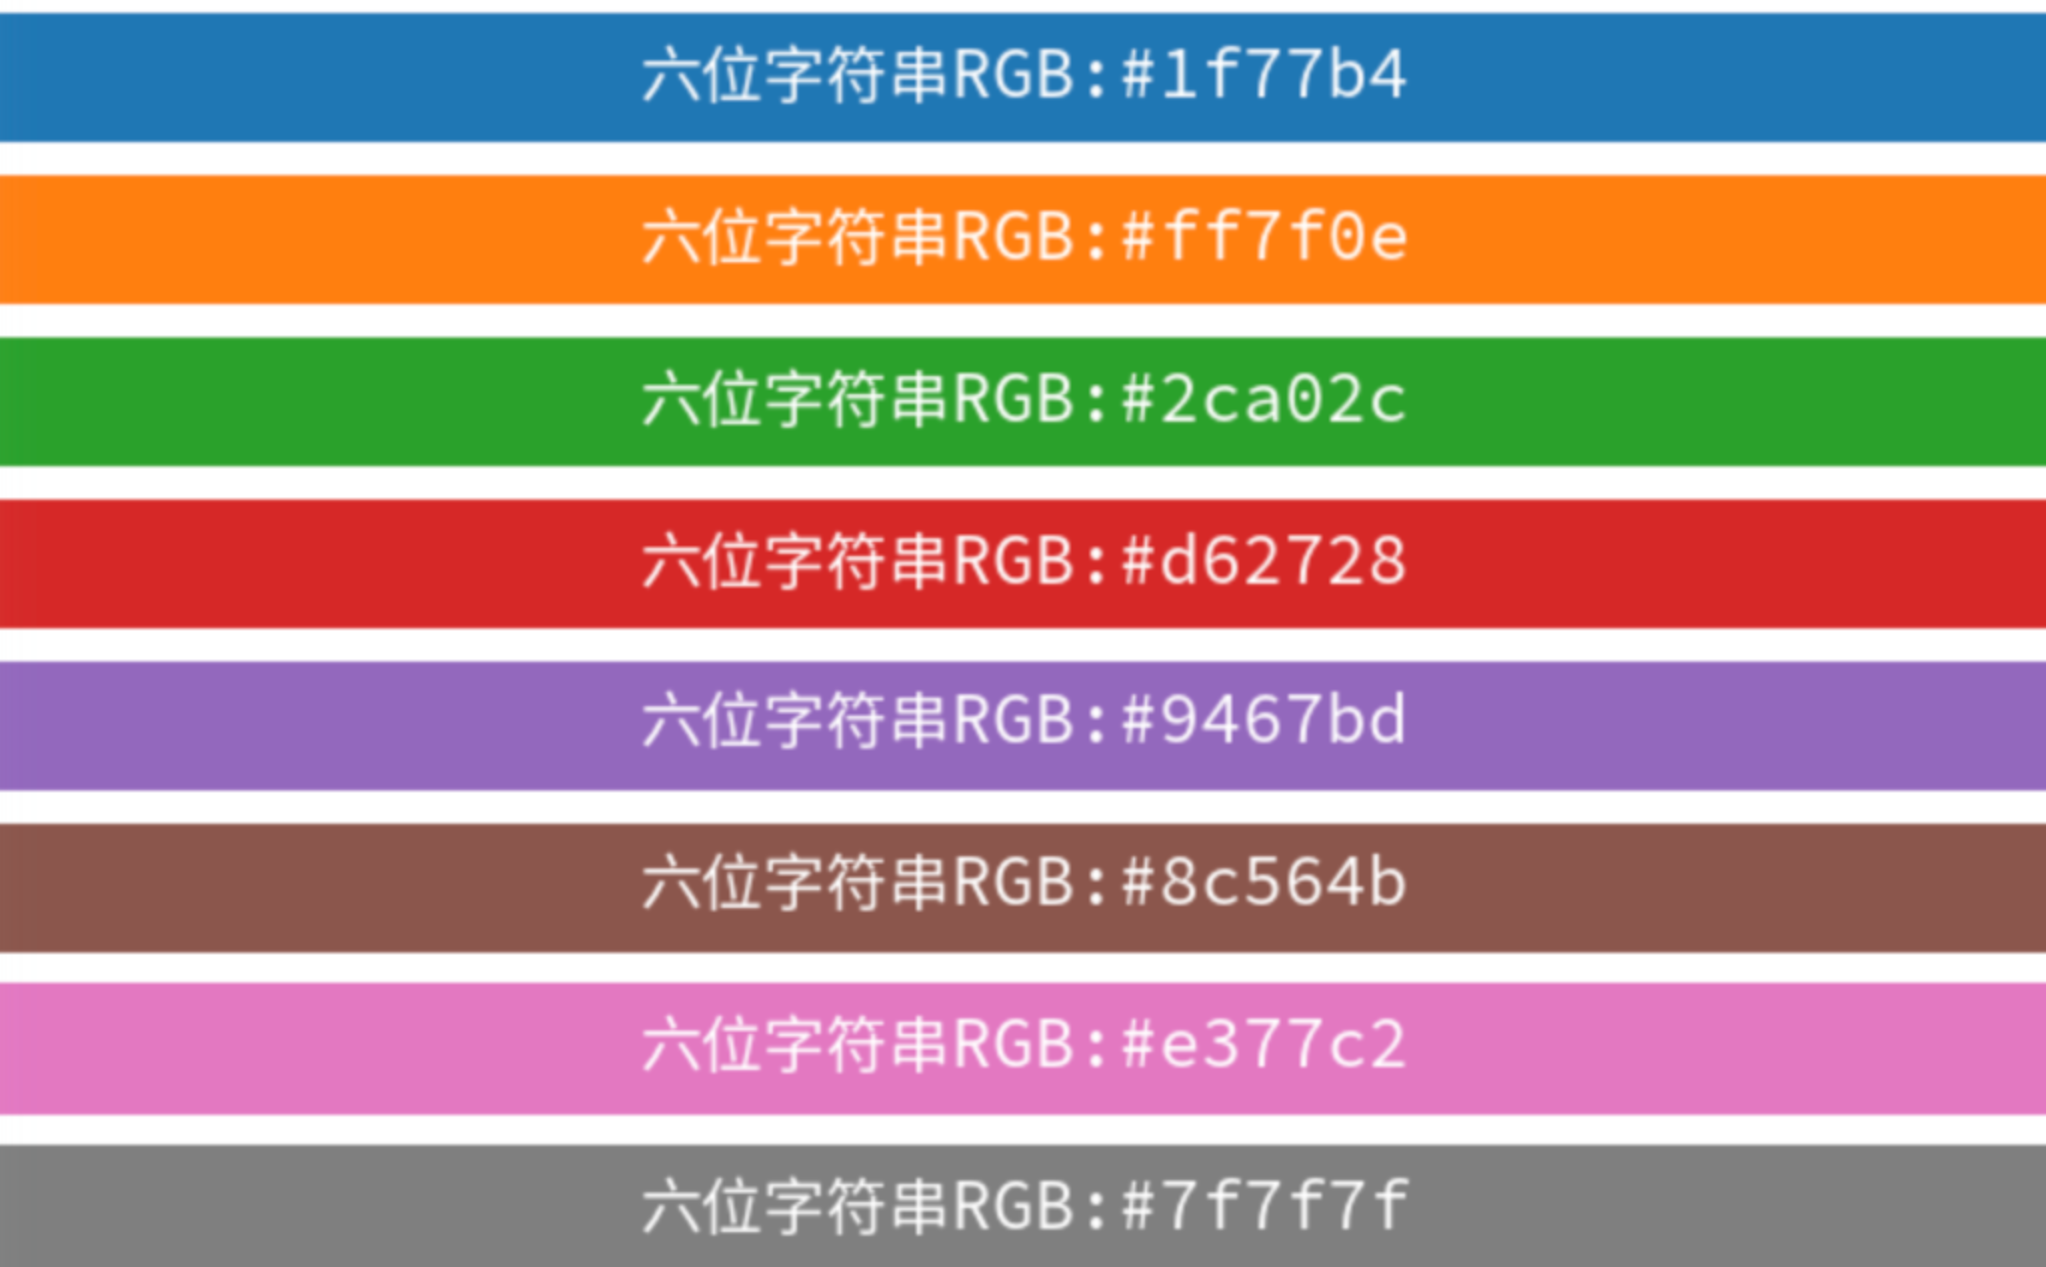
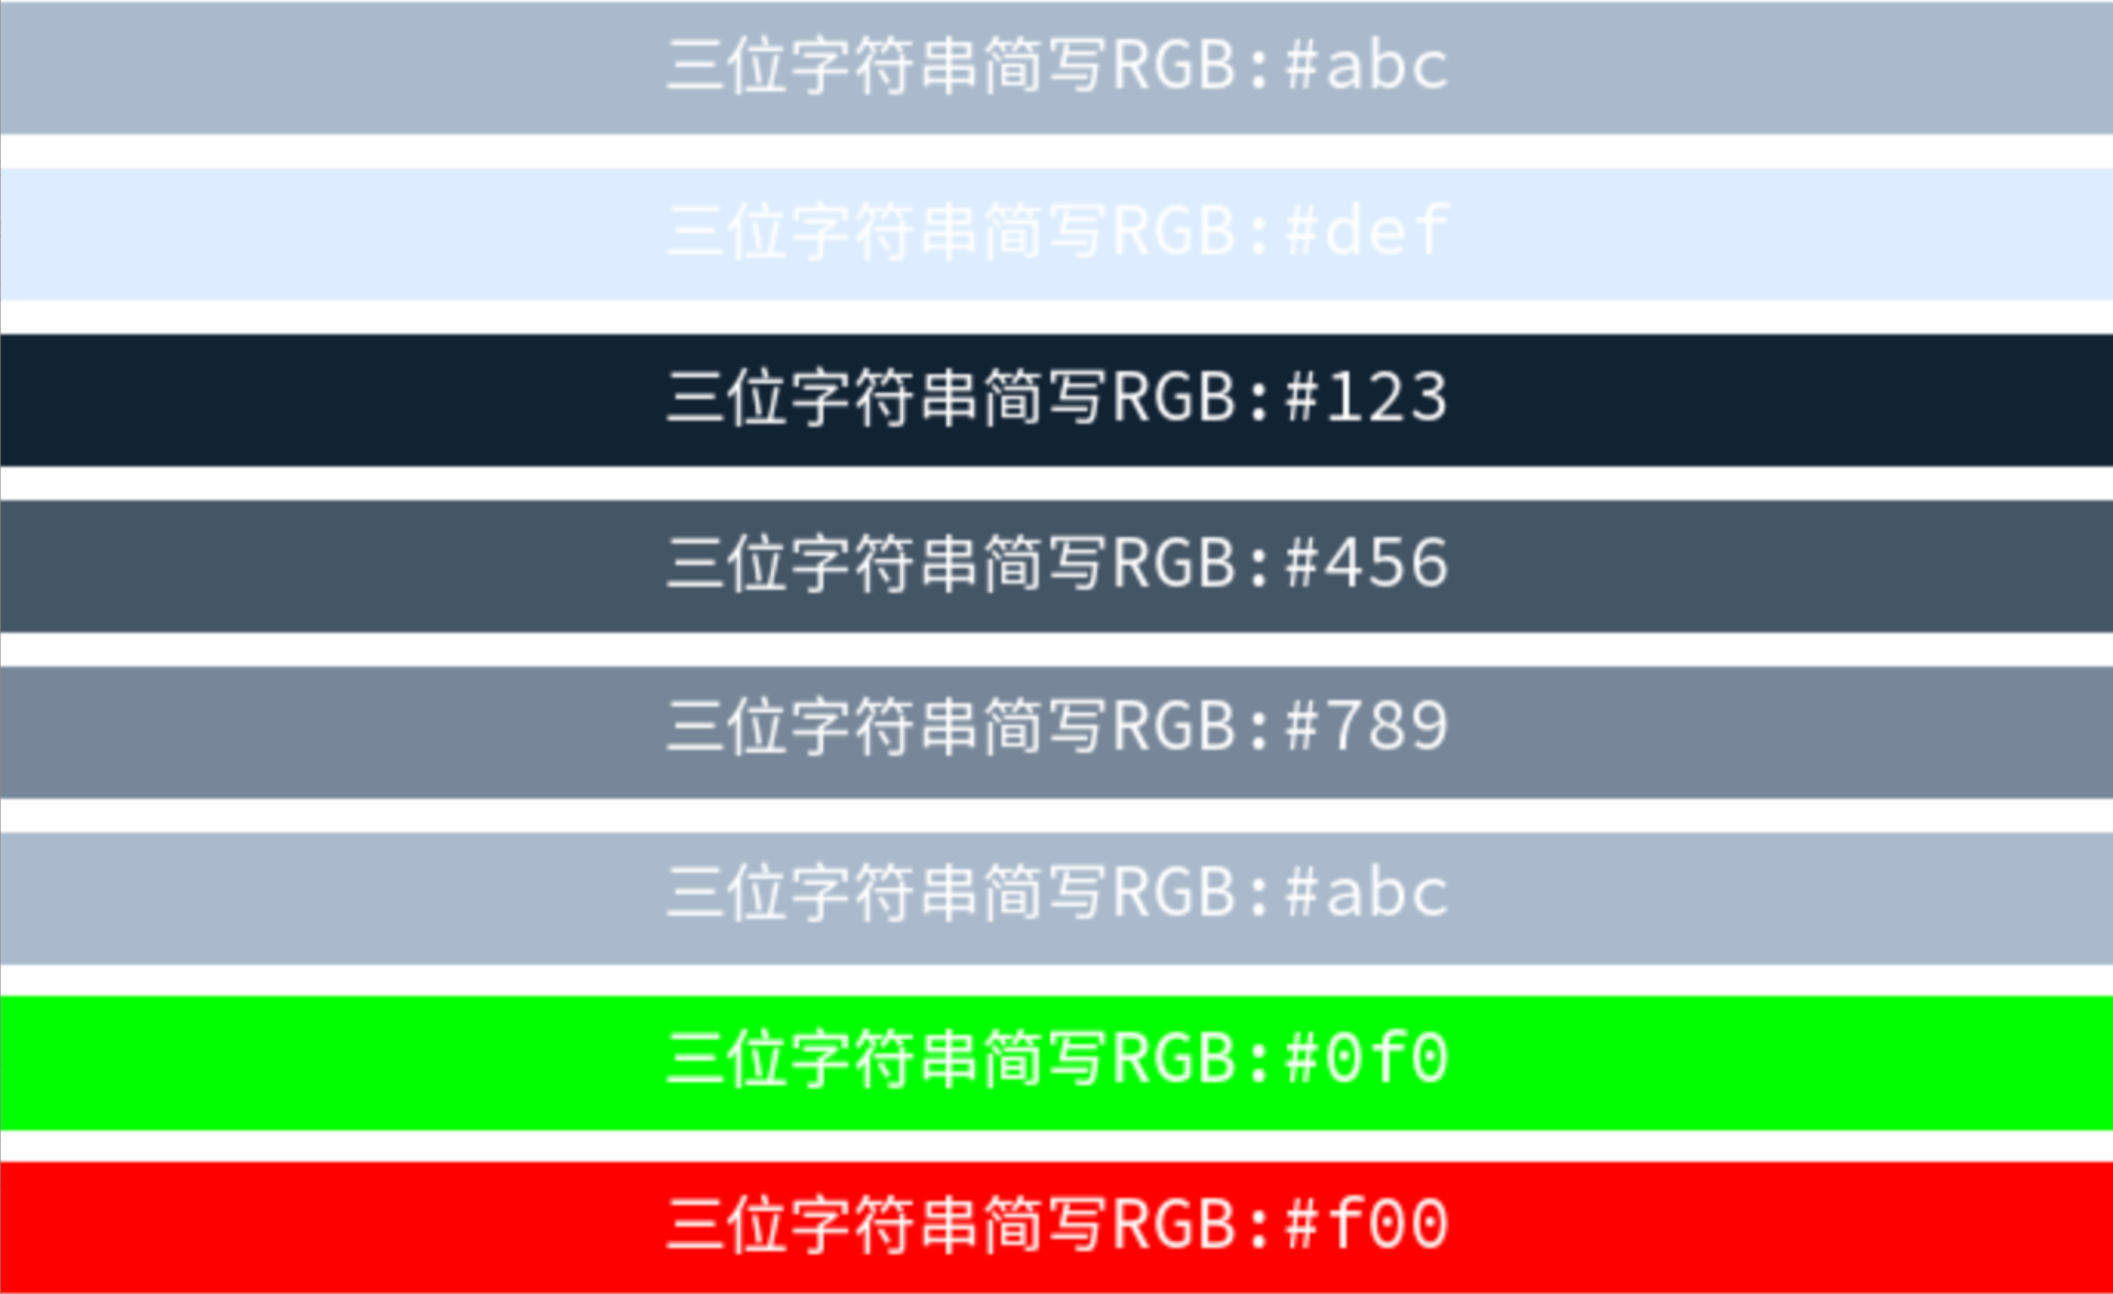
RGB十六进制字符串格式
以#开头的六位十六进制字符串,每两个字符分别代表Red, Green 和 Blue(范围[00, FF])。(#aabbcc可简写为#abc,适合快速定义简单的颜色,但颜色精确度较低。)
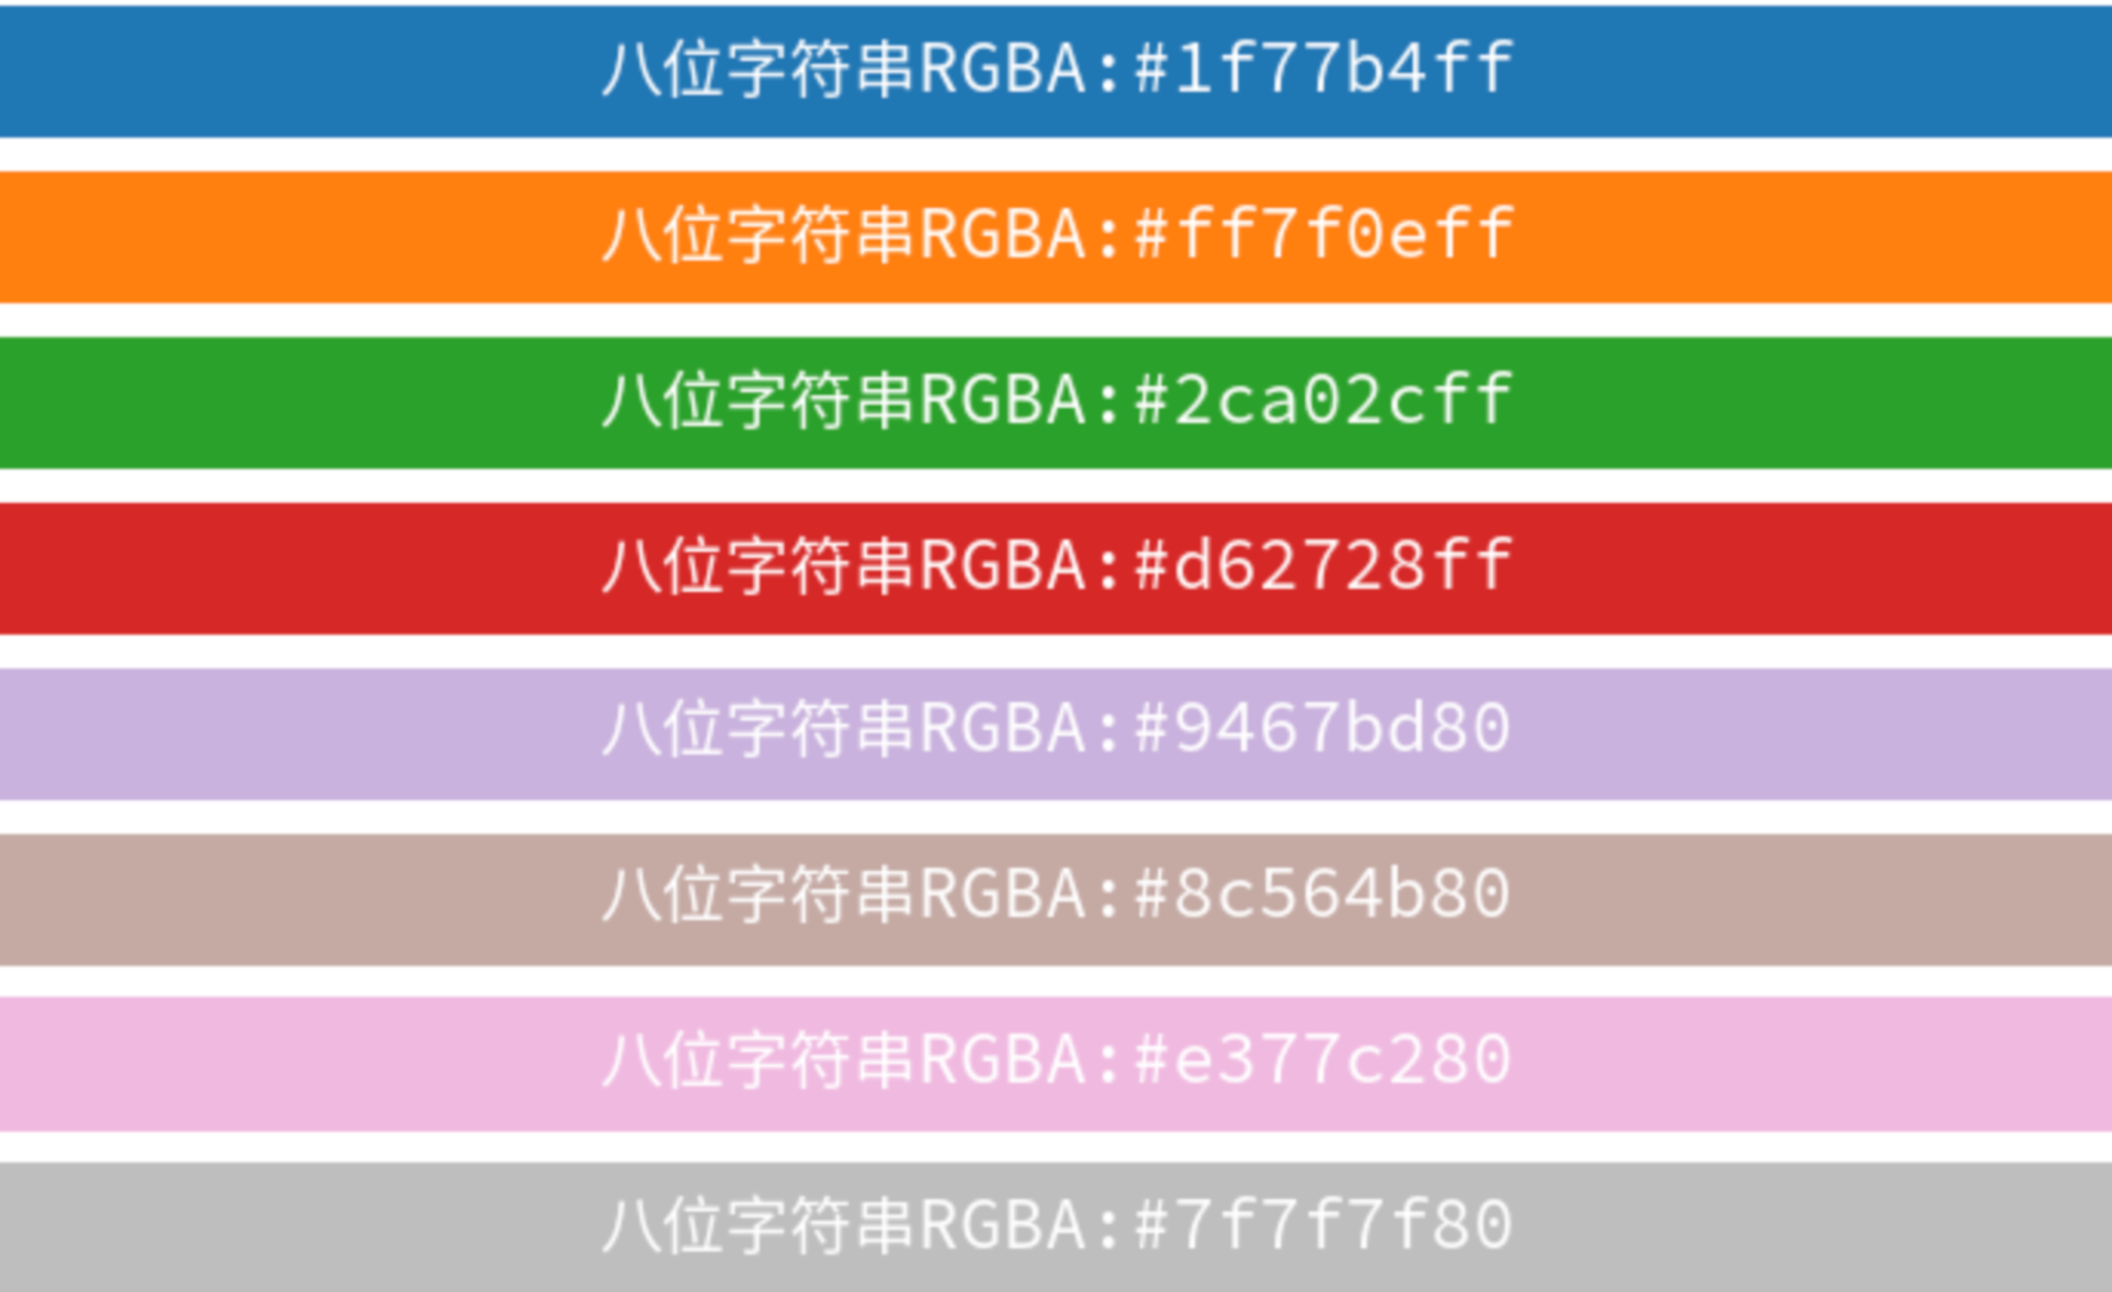
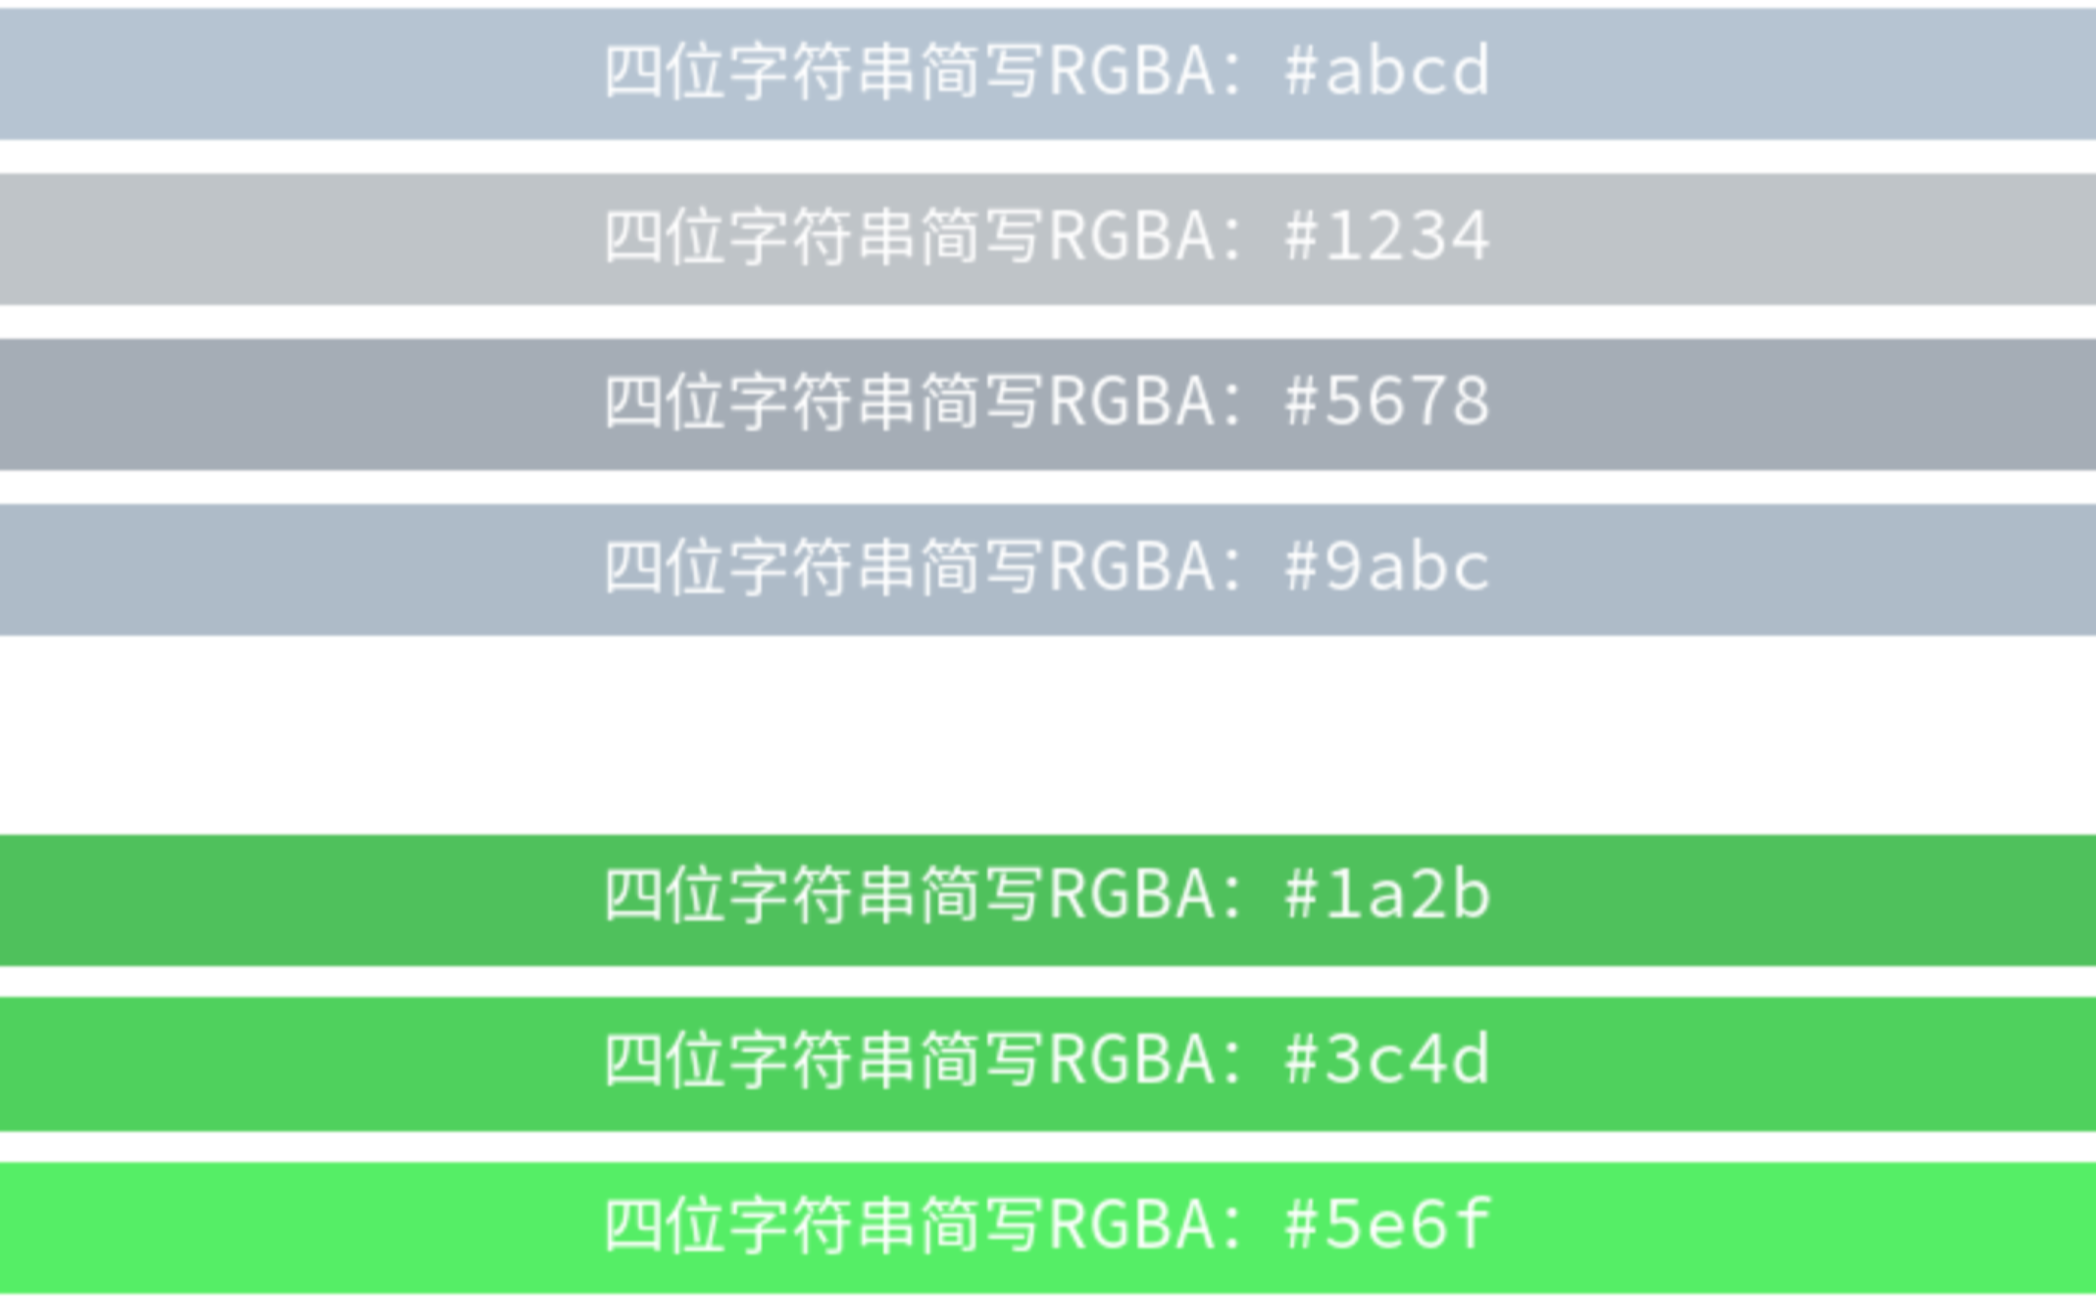
RGBA十六进制字符串格式
以#开头的八位十六进制字符串,每两个字符分别代表Red, Green, Blue 和 Alpha(范围[00, FF])。(#aabbccdd可简写为#abcd,适合快速定义简单的颜色,但颜色精确度较低。)
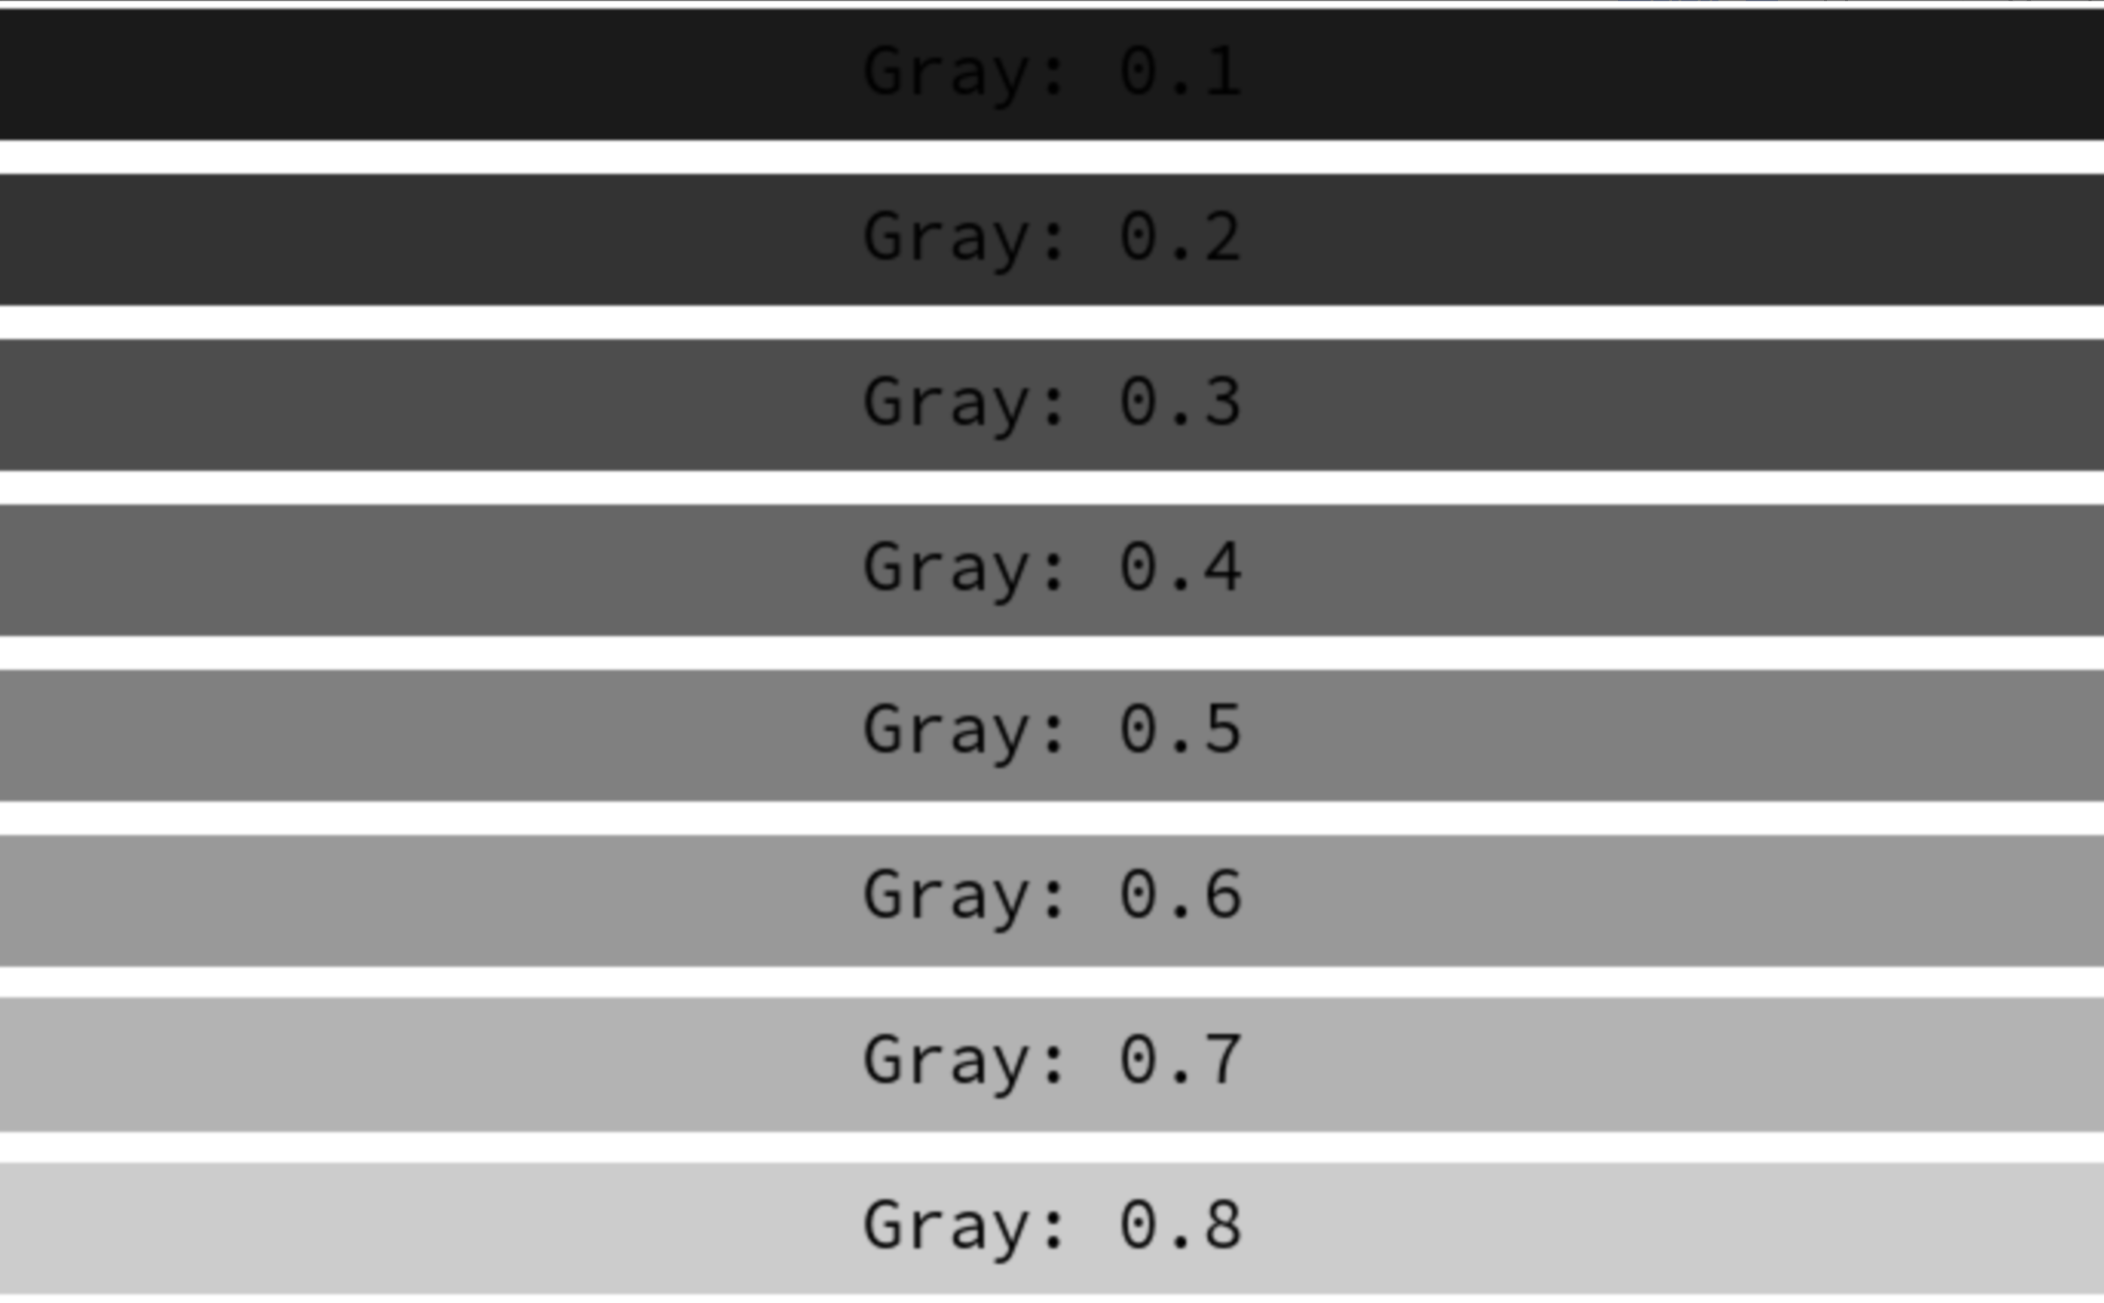
灰度浮点数
浮点型数值位于[0, 1]之间,其中0为纯黑色,1为白色。数值越大颜色越浅,适合需要不同深浅灰色的情境。
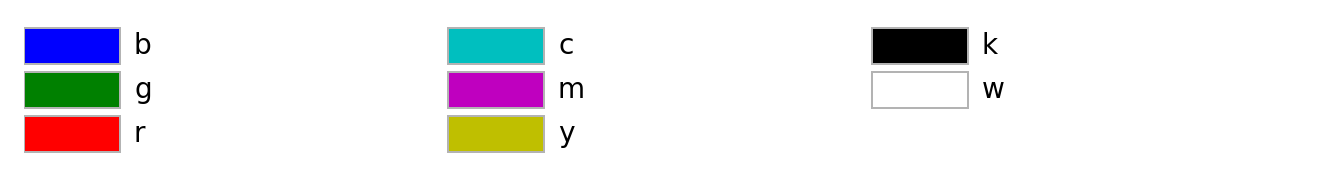
单字母缩写格式
List of named colors — Matplotlib 3.10.0 documentation
| 单字母缩写格式 | |
|---|---|
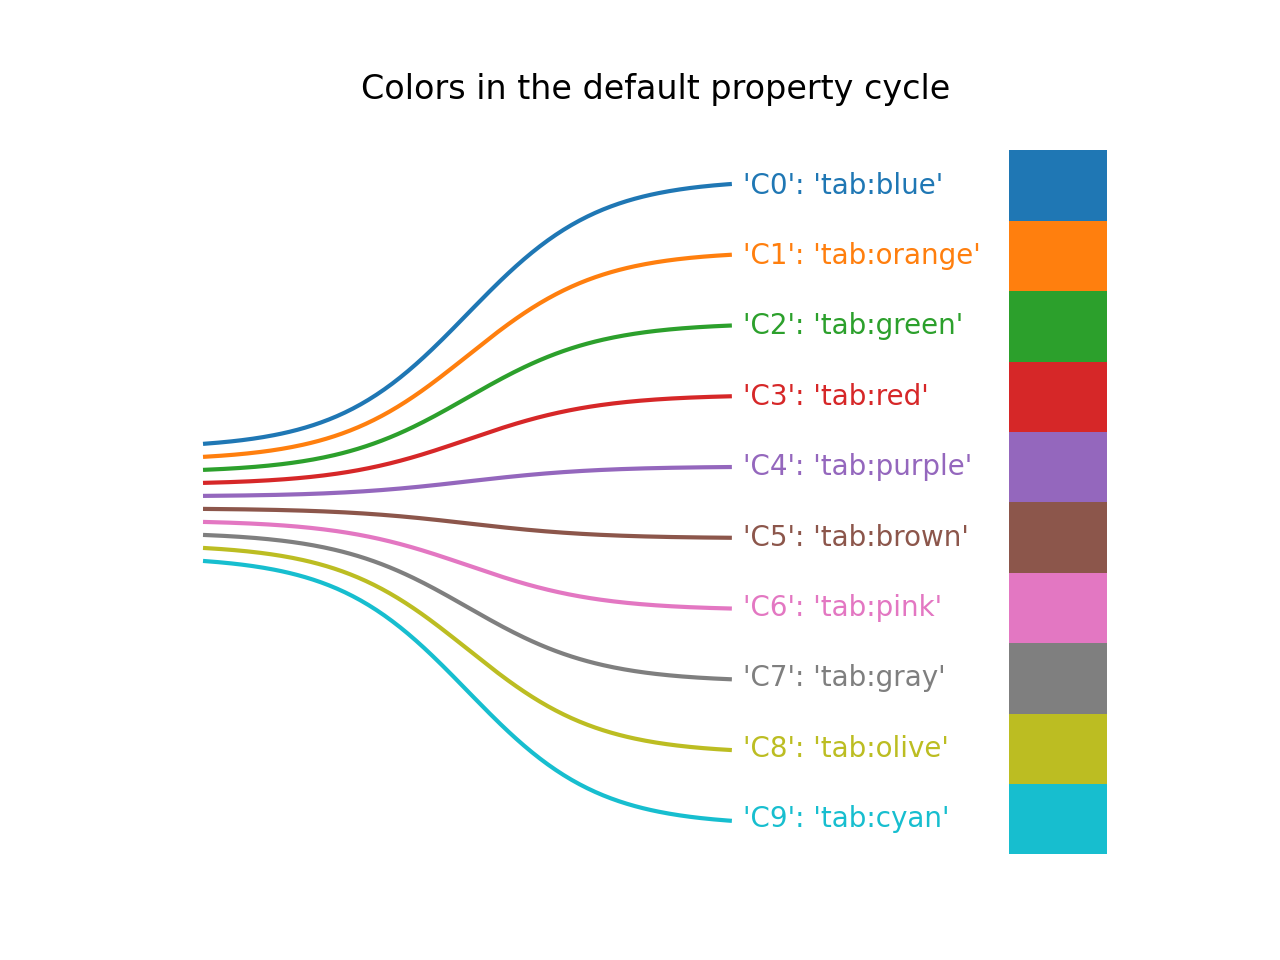
CN格式与TABLEAU格式
Colors in the default property cycle — Matplotlib 3.10.0 documentation
Specifying colors — Matplotlib 3.10.0 documentation
List of named colors — Matplotlib 3.10.0 documentation
"CN"颜色表示法是用来从默认的颜色循环(matplotlib.rcParams['axes.prop_cycle'])中自动选择颜色。'C'后跟一个数字,该数字作为默认属性循环(default property cycle)中的索引。
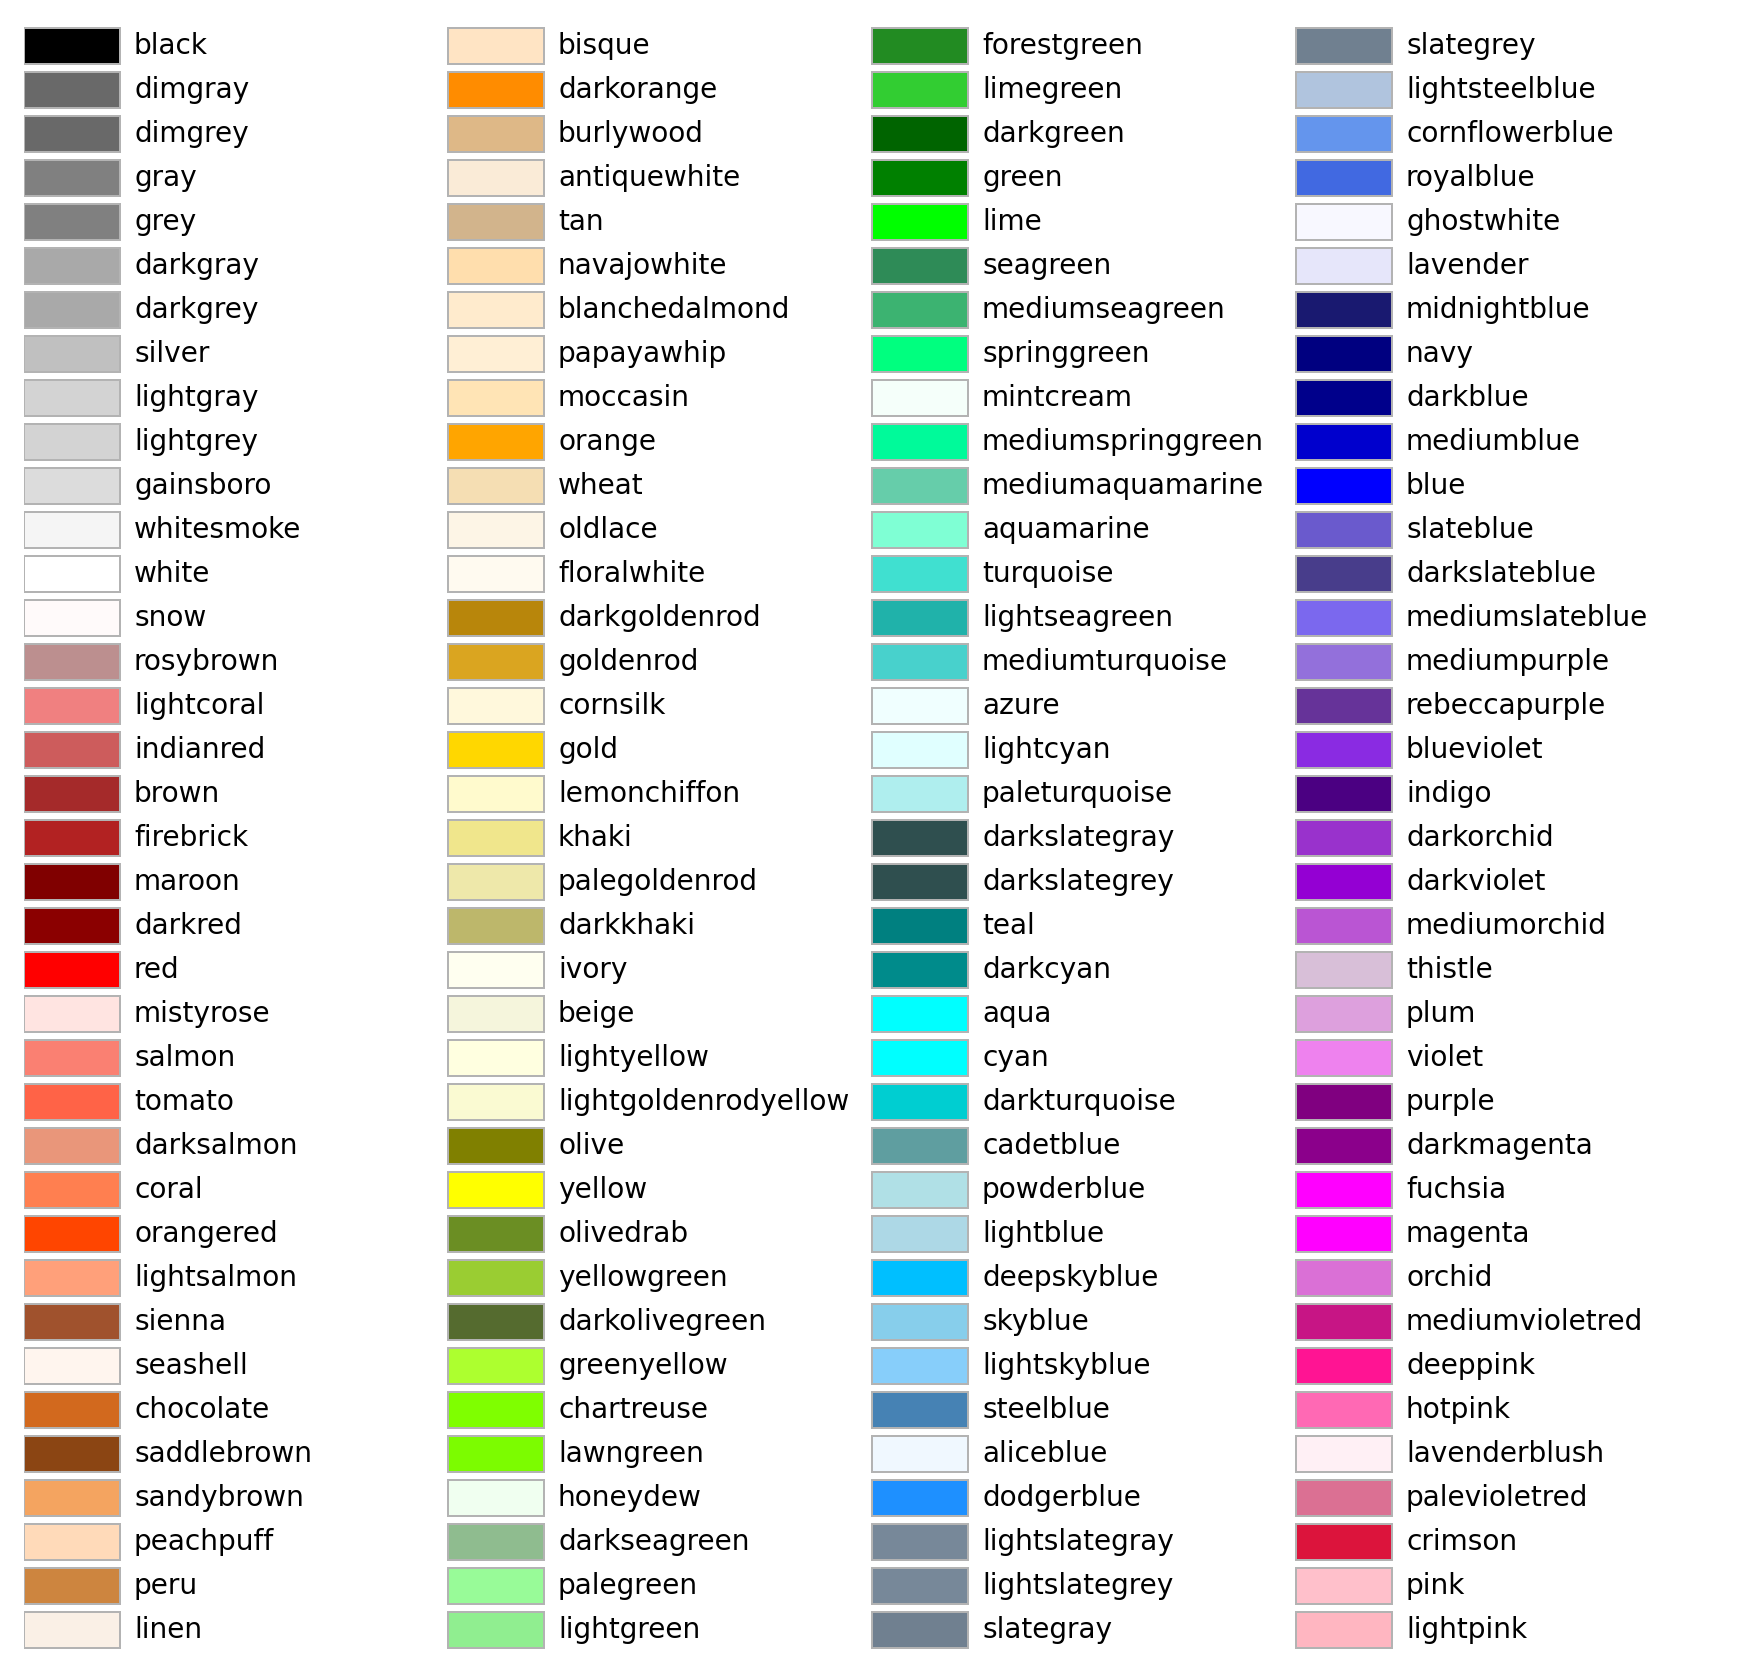
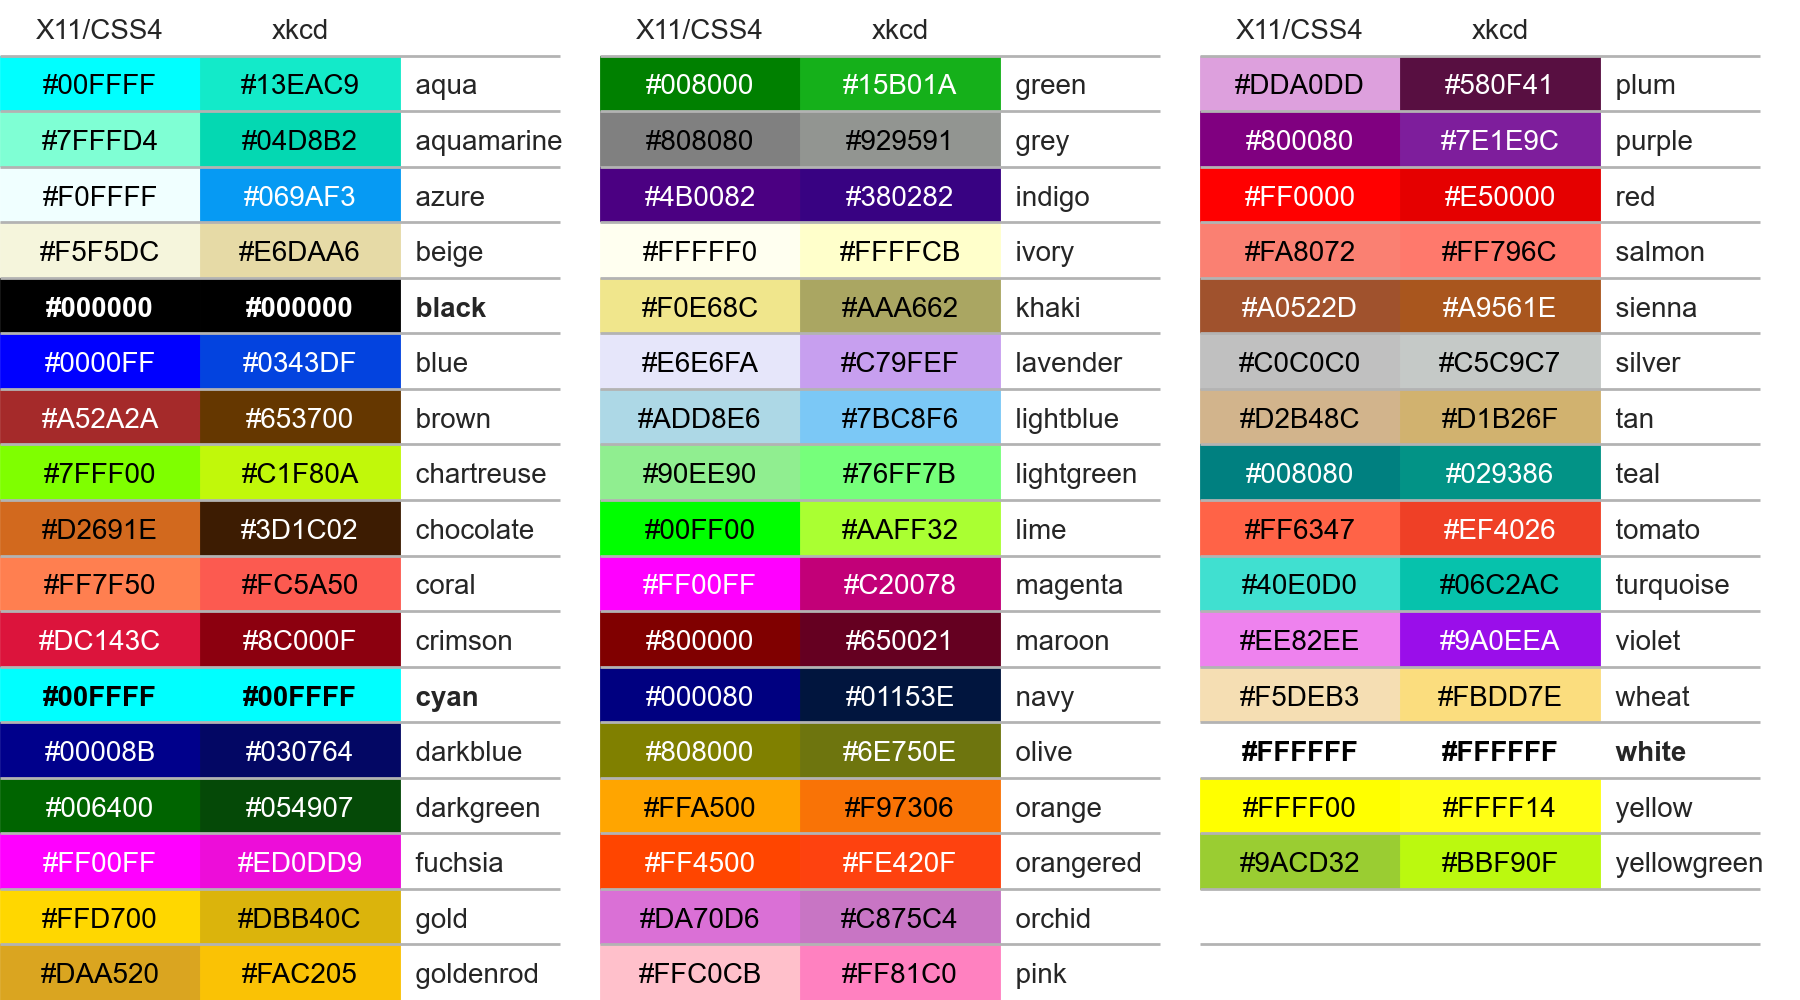
X11/CSS4格式
List of named colors — Matplotlib 3.10.0 documentation
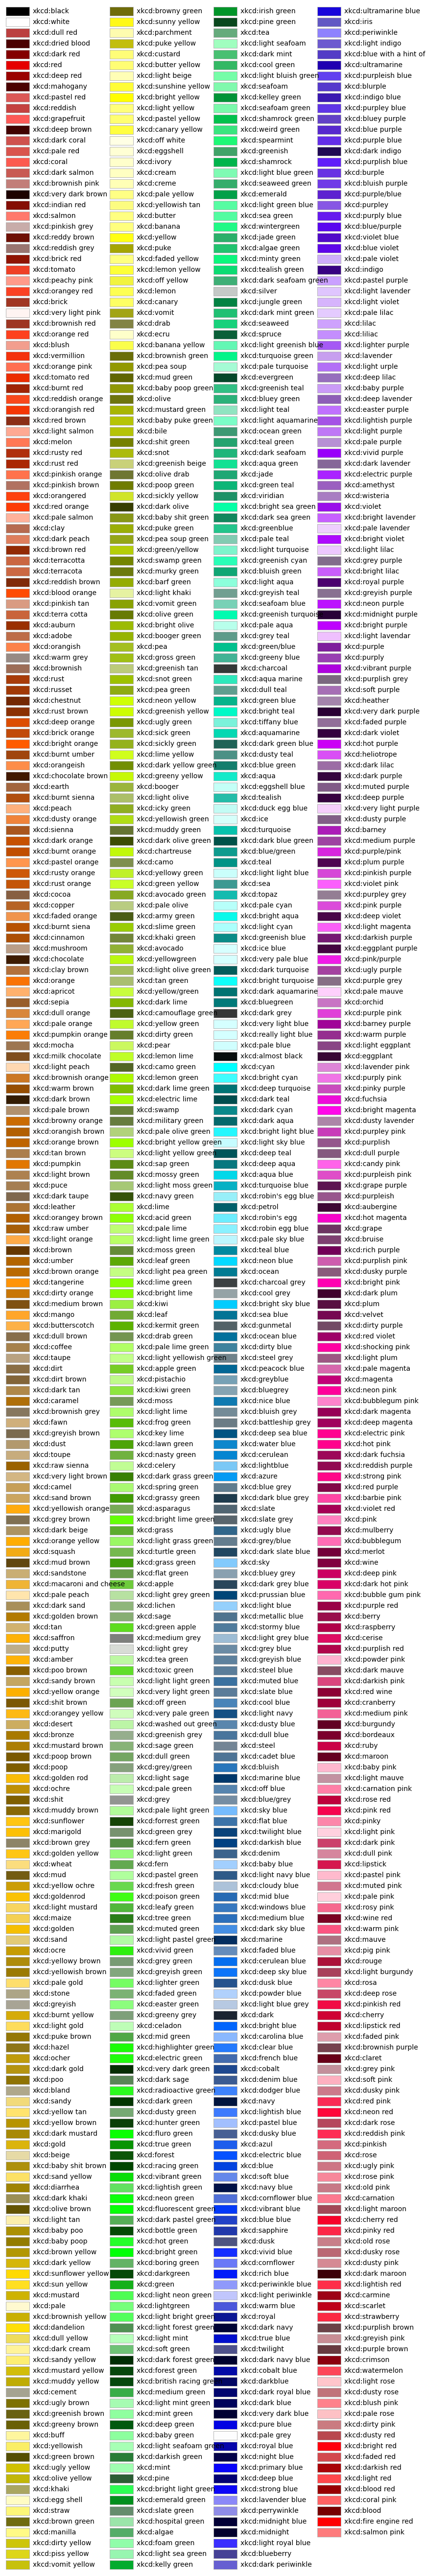
XKCD格式
List of named colors — Matplotlib 3.10.0 documentation
Specifying colors — Matplotlib 3.10.0 documentation
颜色值转换与操作
颜色转换
独立设置hls(set_hls_values)
seaborn.set_hls_values — seaborn 0.13.2 documentation
更新颜色的hls并返回RGB元组
| 独立设置hls(set_hls_values) | |
|---|---|
饱和(saturate)与去饱和(desaturate)
seaborn.saturate — seaborn 0.13.2 documentation
seaborn.desaturate — seaborn 0.13.2 documentation
-
sns.saturate(color):返回同一色调颜色的满饱和度颜色RGB元组 -
sns.desaturate(color, prop):降低颜色的饱和度(*prop)并返回RGB元组
| 饱和(saturate)与去饱和(desaturate) | |
|---|---|
调色板(colormap/Palette)
在matplotlib中,将多种颜色组合成不同的配色方案,每种配色方案称为一个调色板(colormap)。colormap的优势在于它可以通过颜色梯度来展示数据的范围和分布,使数据的高低、趋势或分类一目了然,同时,调用简单,避免一种一种单颜色设置。
Note
在matplotlib中,colormaps一般默认被定义为256个颜色值,即256个RGB或者RGBA的颜色(每种颜色值是一个长度为3或者4的数组,表示RGB值[Red Green Blue]或者RGBA值[Red Green Blue Alpha])。这是因为在大多数图形系统中,256是常用的分辨率,用来平滑显示数据的颜色渐变效果。这些颜色值通常是通过插值或直接定义的方式构建的。
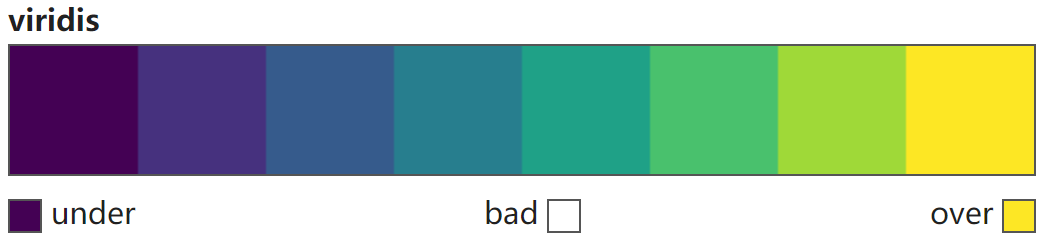
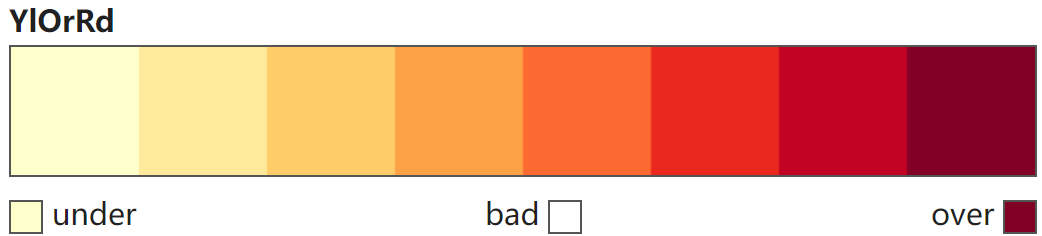
内置调色板
Colormap reference — Matplotlib 3.10.0 documentation
matplotlib.cm — Matplotlib 3.10.0 documentation
调用形式:
-
name:如'viridis'
-
Colormap对象
-
mpl.colormaps[name]:如mpl.colormaps['viridis'] -
mpl.colormaps.get_cmap(name):如mpl.colormaps.get_cmap("viridis")如果name为None,则返回rcParams["image.cmap"]中定义的Colormap对象,默认为'viridis'。
-
plt.get_cmap(name):如plt.get_cmap("viridis")。同上 -
mpl.cm.name:如mpl.cm.viridis
-
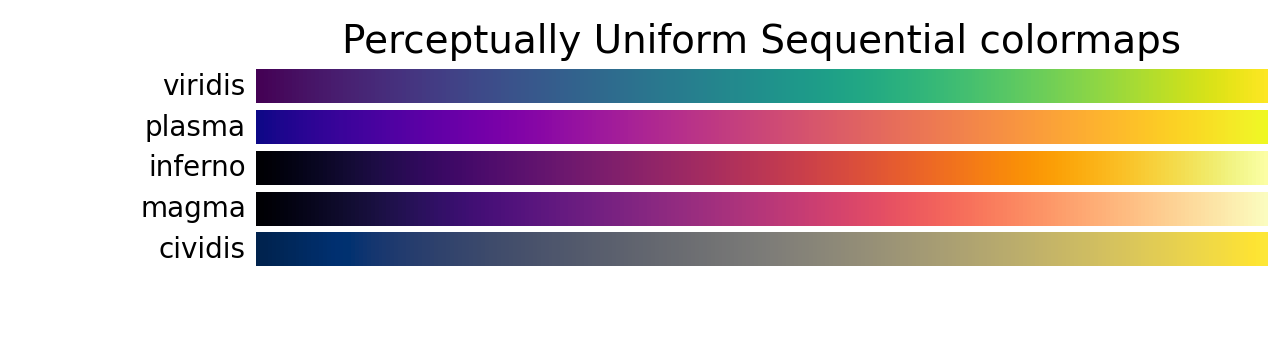
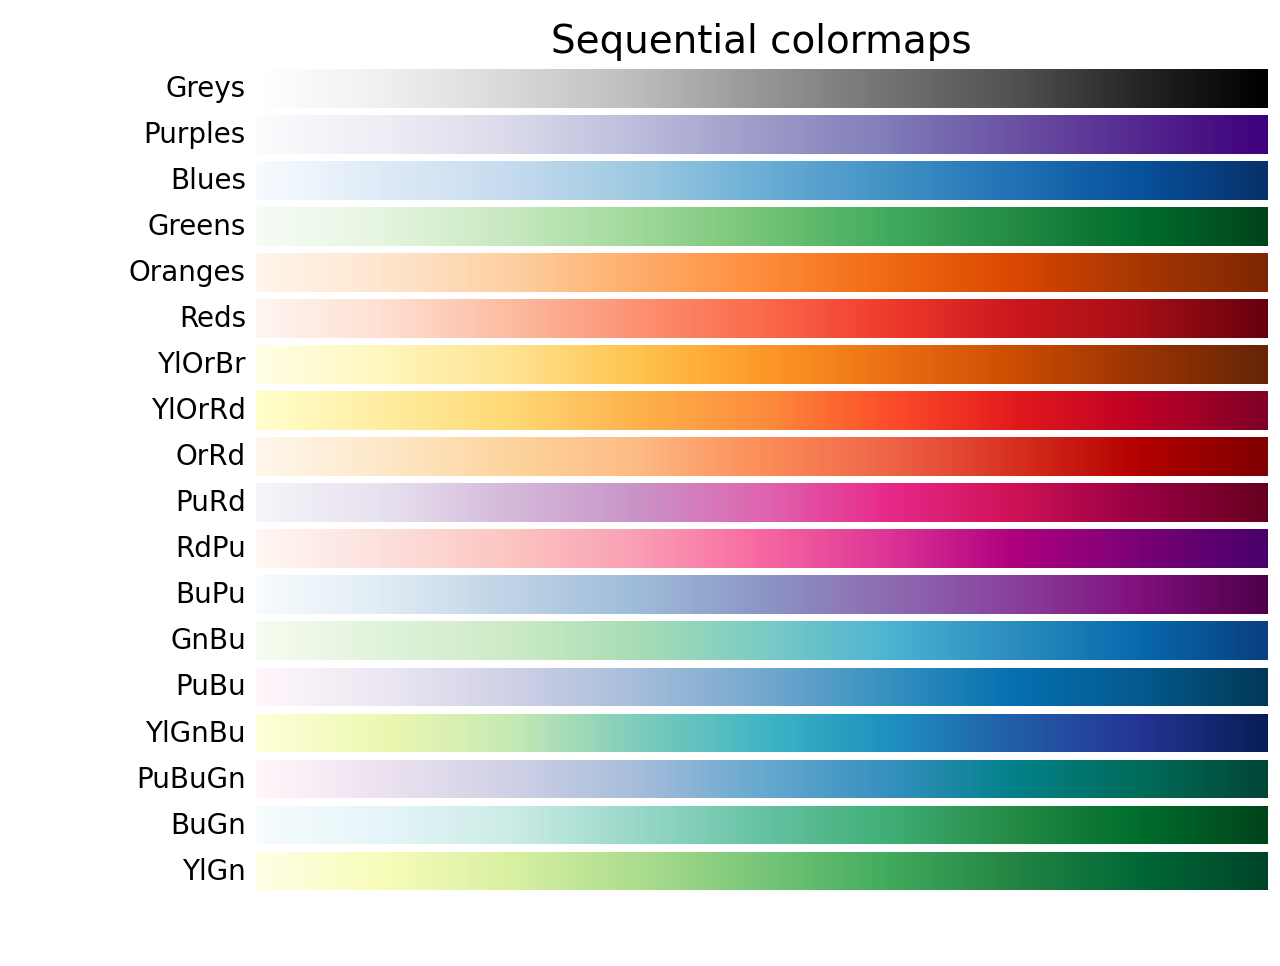
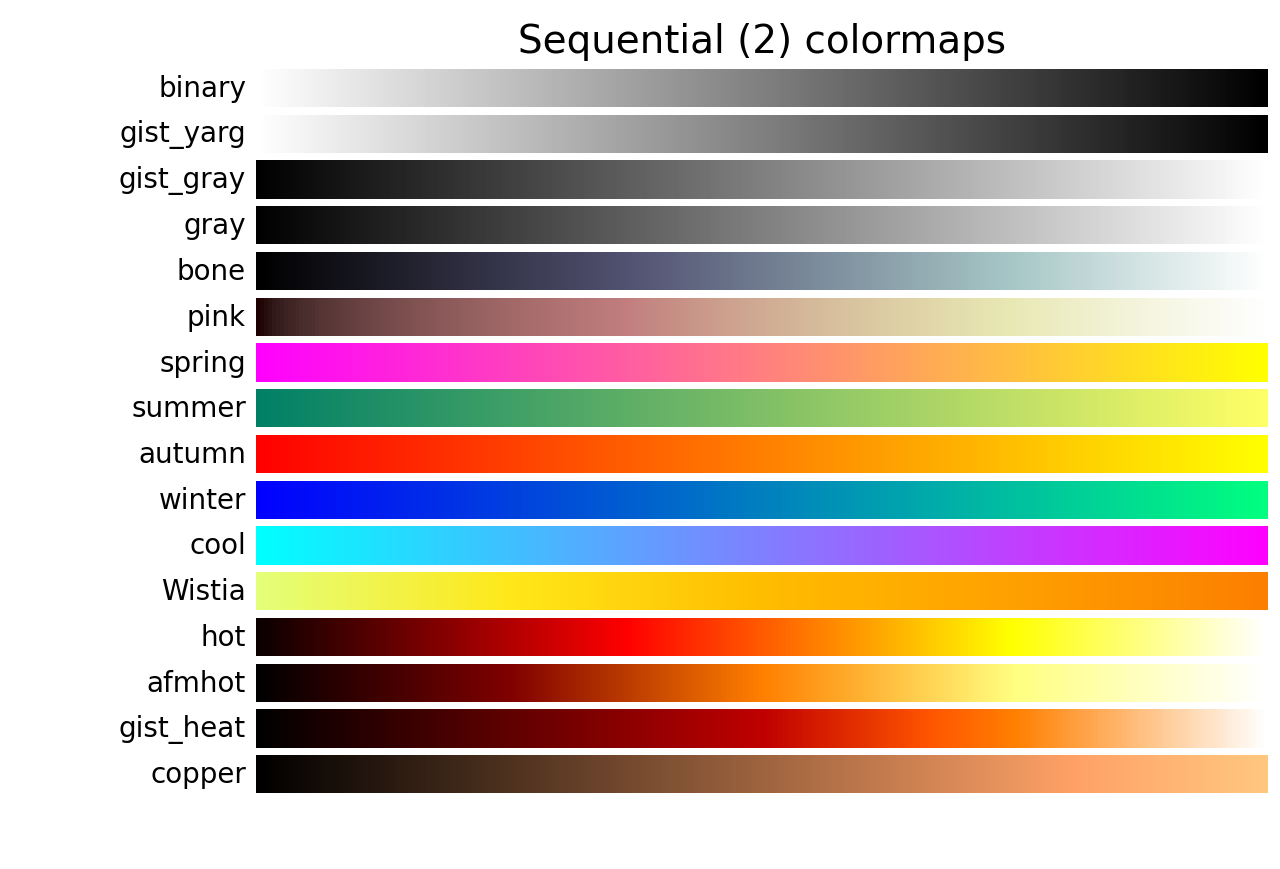
顺序调色板(sequential colormaps,39 x 2)
Choosing Colormaps in Matplotlib — Matplotlib 3.10.0 documentation
Choosing Colormaps in Matplotlib — Matplotlib 3.10.0 documentation
顺序调色板的特点是色调逐步变化,通常单一色调会随着亮度或饱和度的增加逐渐过渡。这类colormap 适用于有自然顺序的数据,例如数值随大小递增或递减的情况。常见应用场景包括表示温度、浓度、密度等连续性数据,使观众能直观地感受到数据变化的渐进性。
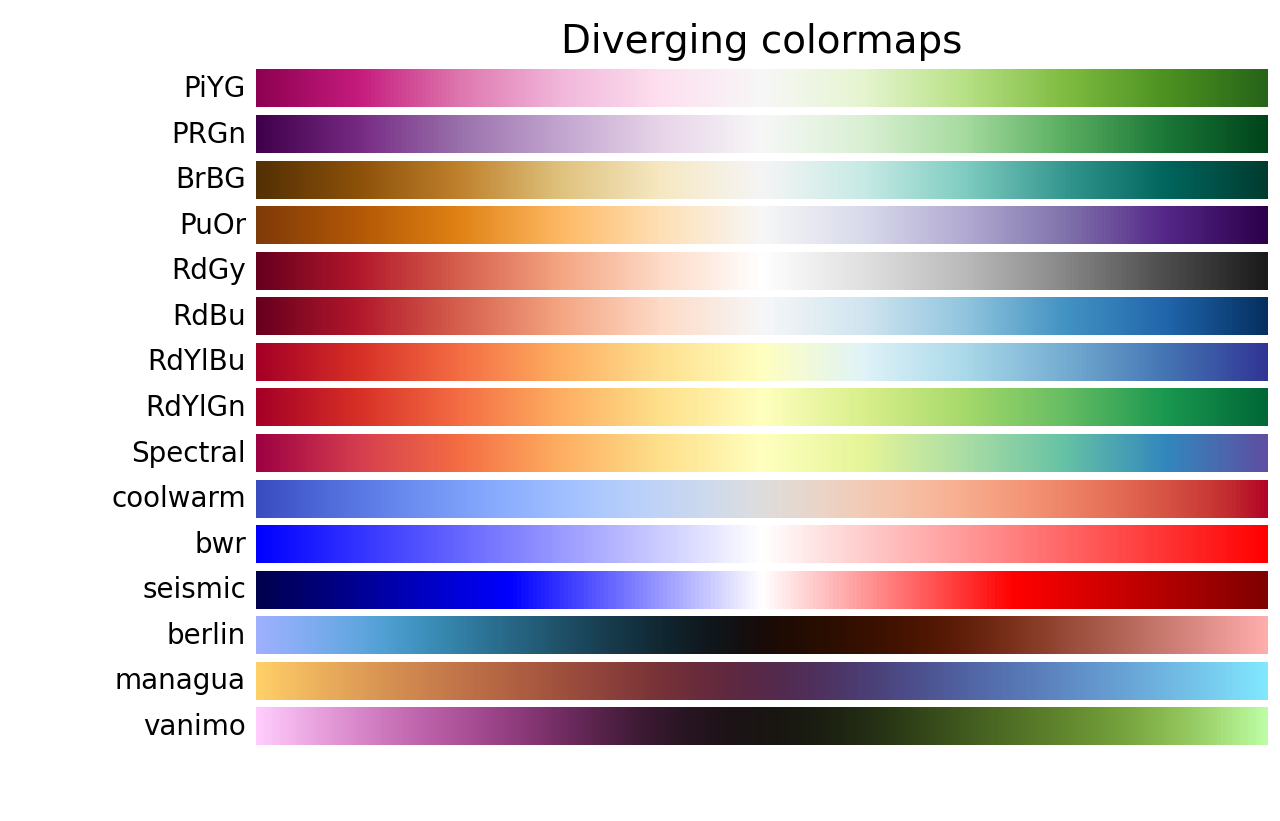
离散调色板(diverging colormaps,15 x 2)
Choosing Colormaps in Matplotlib — Matplotlib 3.10.0 documentation
离散调色板的特点是在两种不同颜色之间变化,颜色的亮度和饱和度逐渐变化,且在中间部分通常使用未饱和的颜色。它 适用于数据中有关键中值的情况,比如地形图或数据围绕零值波动时,可以清晰地展示数据的正负差异以及中立区域,从而突出数据的对称性或变化的关键点。
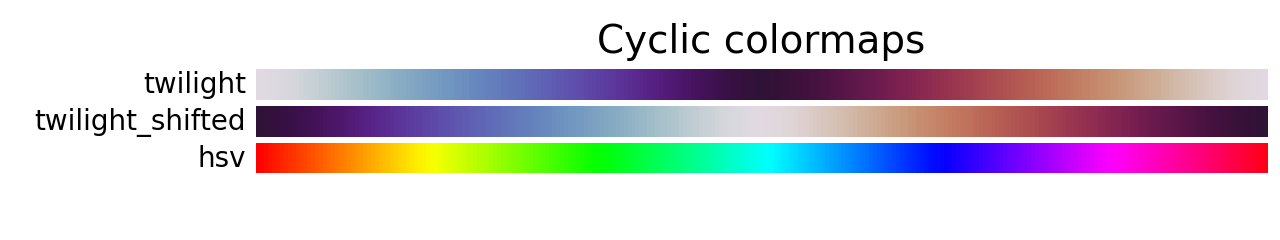
循环调色板(cyclic colormaps,3 x 2)
Choosing Colormaps in Matplotlib — Matplotlib 3.10.0 documentation
循环调色板通过两种不同的颜色在中间逐渐过渡,并在两端以一个去饱和的色调连接。这种色图 适用于具有循环特性的数值,例如相位角、风向或者一天中的时间等,这些数据的值在达到某个极限后会重新回到起点。通过使用循环型色图,可以直观地展示数据的周期性变化,避免在数据的起始和结束点产生不必要的断裂感。
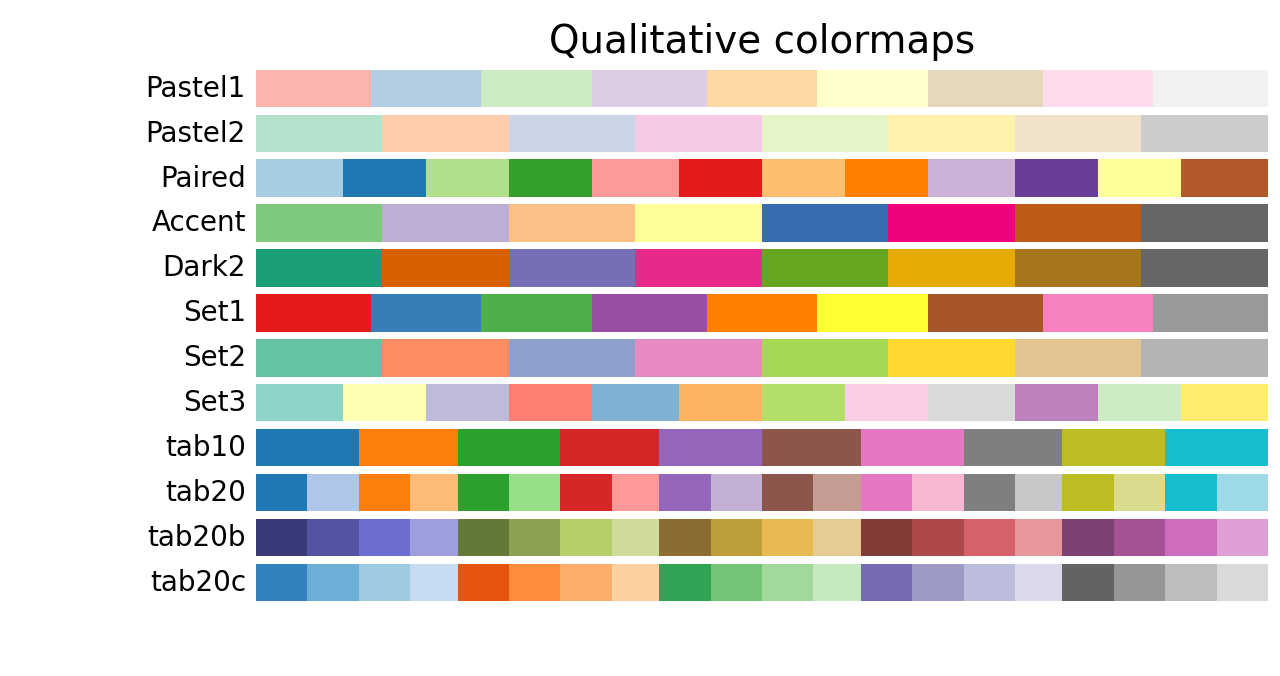
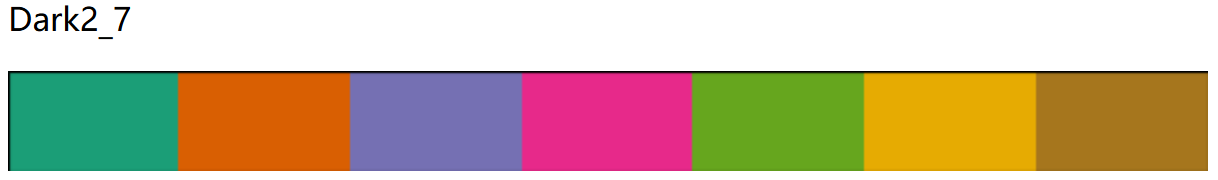
定性调色板(qualitative colormaps,12 x 2)
Choosing Colormaps in Matplotlib — Matplotlib 3.10.0 documentation
定性调色板通常使用多种不同的颜色,旨在区分没有内在顺序或关系的数据。这类色图非常 适合用于表示类别性的数据,例如不同的种类、群体或类别,其中各个数据之间没有大小或优先级的关系。定性型色图通过鲜明的色彩对比,使得每个类别的数据更加容易区分,从而帮助我们清晰地识别数据中的不同分类信息。
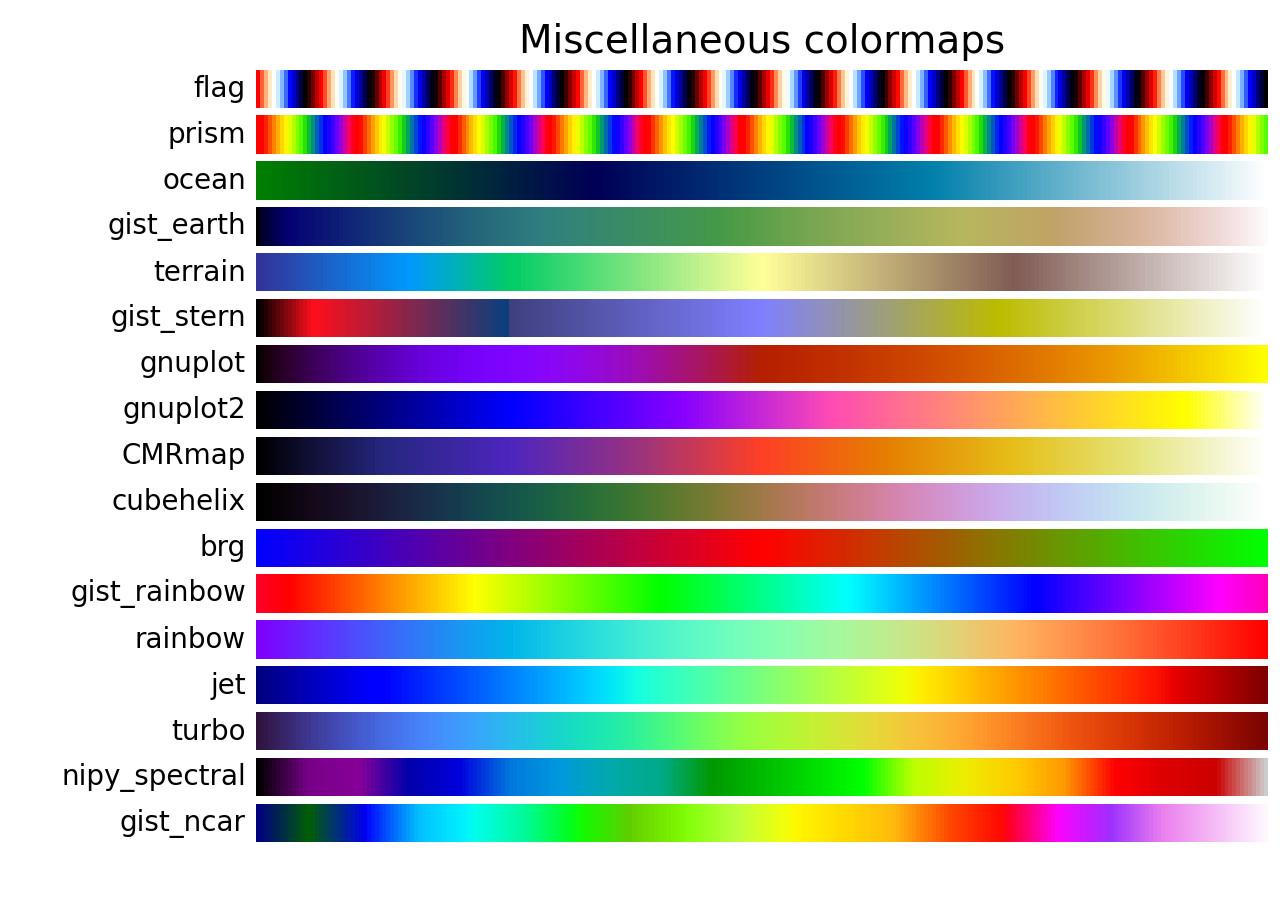
混杂调色板(miscellaneous colormaps,17 x 2)
Choosing Colormaps in Matplotlib — Matplotlib 3.10.0 documentation
混杂调色板包含一些特殊用途的色图,它们是为了特定的绘图需求而设计的。例如gist_earth、ocean和terrain色图通常用于绘制地形图,其中绿棕色代表地面,蓝色侧则代表水深,适用于地理和海洋相关的可视化。
自定义调色板
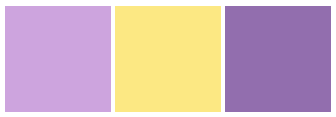
ListedColormap调色板
Creating Colormaps in Matplotlib — Matplotlib 3.10.0 documentation
matplotlib.colors.ListedColormap — Matplotlib 3.10.0 documentation
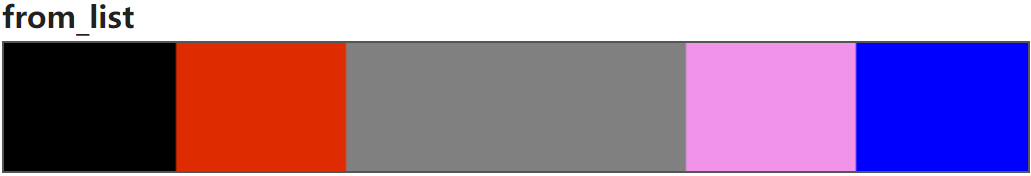
ListedColormap调色板通过预定义的一组离散颜色创建,返回一个Colormap对象。它 适合显示有分类特征的数据 。内置的 顺序调色板('magma', 'inferno', 'plasma', 'viridis', 'cividis')、离散调色板('berlin', 'managua', 'vanimo')、循环调色板('twilight', 'twilight_shifted')、定性调色板、混杂调色板('turbo') 即是通过此方式创建。
通过mpl.colors.ListedColormap(colors, name="from_list", N=None)实现。
LinearSegmentedColormap调色板
Creating Colormaps in Matplotlib — Matplotlib 3.10.0 documentation
matplotlib.colors.LinearSegmentedColormap — Matplotlib 3.10.0 documentation
LinearSegmentedColormap调色板通过将给定颜色锚定在锚点,然后在锚点颜色间插入连续的颜色渐变而创建,返回一个Colormap对象。适合表现数据的连续变化。内置的调色板中除上述外均以此方式创建。
通过mpl.colors.LinearSegmentedColormap.from_list(name, colors, N=256)实现。
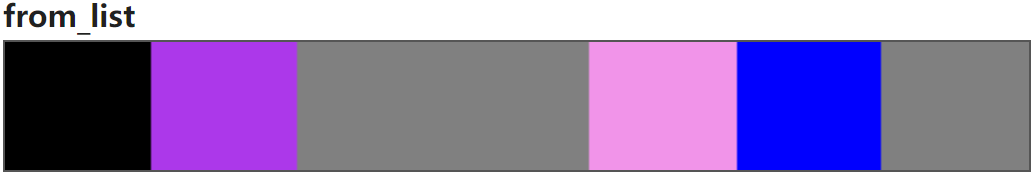
| (value, color)锚点列表 | |
|---|---|
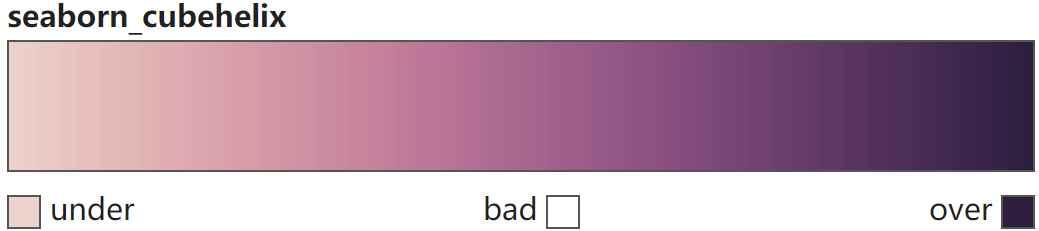
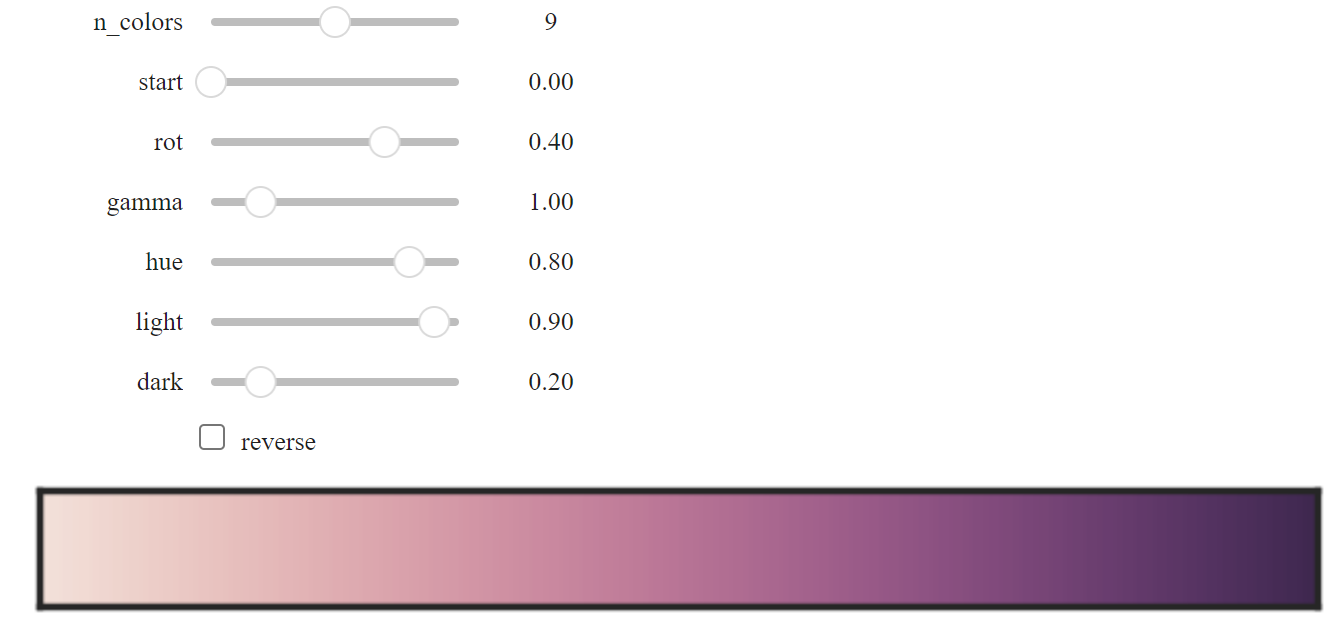
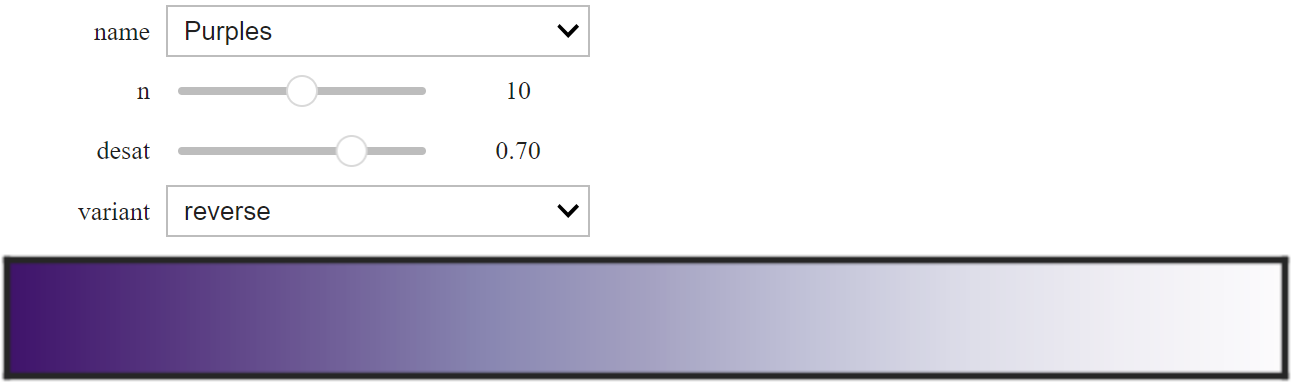
cubehelix调色板
seaborn.cubehelix_palette — seaborn 0.13.2 documentation
seaborn.choose_cubehelix_palette — seaborn 0.13.2 documentation
基于cubehelix(立方螺旋)系统构建sequential调色板,生成一个 亮度线性递减(或递增) 的调色板,使用该颜色生成的图形无论是打印成黑白图像或被色盲者观看时都依然能够清晰展现数据的不同特征。
Note
此外,可以使用以 'ch: <cubehelix arguments> [_r]' 字符串生成 cubehelix调色板:
"ch: s=...,r=..., g=..., h=..., l=..., d=... [_r]",其中s="start", r="rot", g="gamma", h="hue", l="light", d="dark",_r表示reverse=True
| cubehelix_palette | |
|---|---|
- 颜色数
- 螺旋起始处色调值[0, 3]
- 色轮旋转值[-1, 1]
- 非线性突出暗色[0, 1)或亮色(1, +∞)
- 色彩饱和度[0, 1]
- 最亮色强度[0, 1]
- 最暗色强度[0, 1]
- True:暗→亮;False:亮→暗
- True:返回Colormap对象;False:返回RGB元组列表
| choose_cubehelix_palette | |
|---|---|
dark调色板
seaborn.dark_palette — seaborn 0.13.2 documentation
seaborn.choose_dark_palette — seaborn 0.13.2 documentation
混合深色和指定颜色,构建sequential调色板,生成一个 深色到指定色 的调色板。适用于数据的范围在感兴趣的高值数据~不感兴趣的低值数据之间的变化情况。
color 参数可以通过多种方式指定,包括 matplotlib 中定义颜色的所有选项以及 seaborn 处理的一些额外的颜色空间,还可以使用 XKCD 颜色调查的命名颜色数据库。
Note
此外,可以使用以 'dark:<color>[_r]' 字符串生成dark调色板
| dark_palette | |
|---|---|
- 高值颜色(十六进制、RGB元组、html颜色名)
- 解释color的颜色空间,可选‘rgb’, ‘hls’, ‘husl’, xkcd’
- 颜色数
- True:指定色→深色;False:深色→指定色
- True:返回Colormap对象;False:返回RGB元组列表
| choose_dark_palette | |
|---|---|
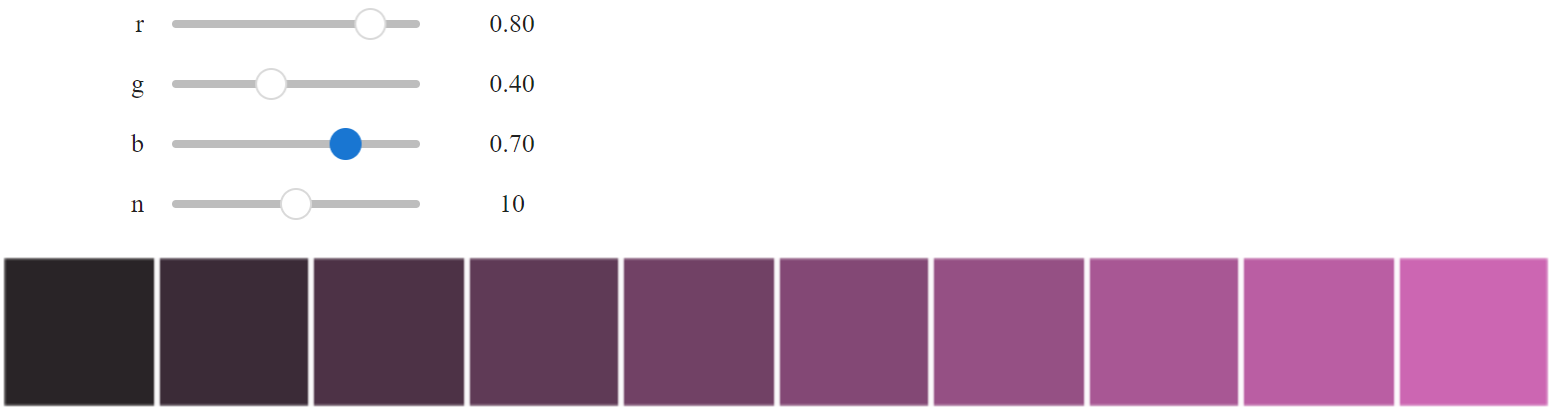
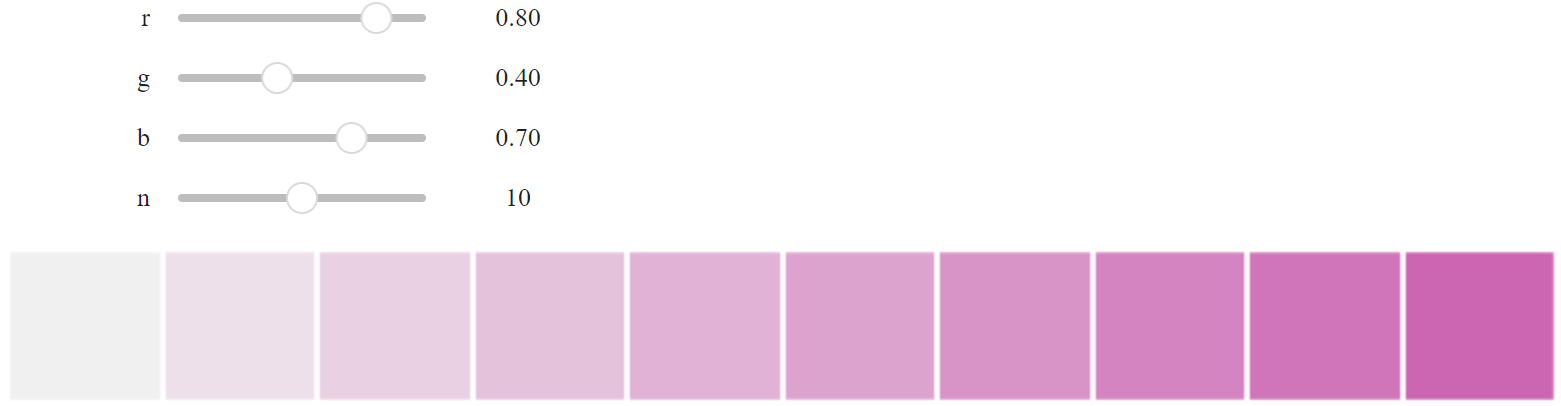
light调色板
seaborn.light_palette — seaborn 0.13.2 documentation
seaborn.choose_light_palette — seaborn 0.13.2 documentation
混合亮色和指定颜色,构建sequential调色板,生成一个 浅色到指定色 的调色板。
Note
此外,可以使用以 'light:<color>[_r]' 字符串生成light调色板
| light_palette | |
|---|---|
- 高值颜色(十六进制、RGB元组、html颜色名)
- 解释color的颜色空间,可选‘rgb’, ‘hls’, ‘husl’, xkcd’
- 颜色数
- True:指定色→浅色;False:浅色→指定色
- True:返回Colormap对象;False:返回RGB元组列表
| choose_light_palette | |
|---|---|
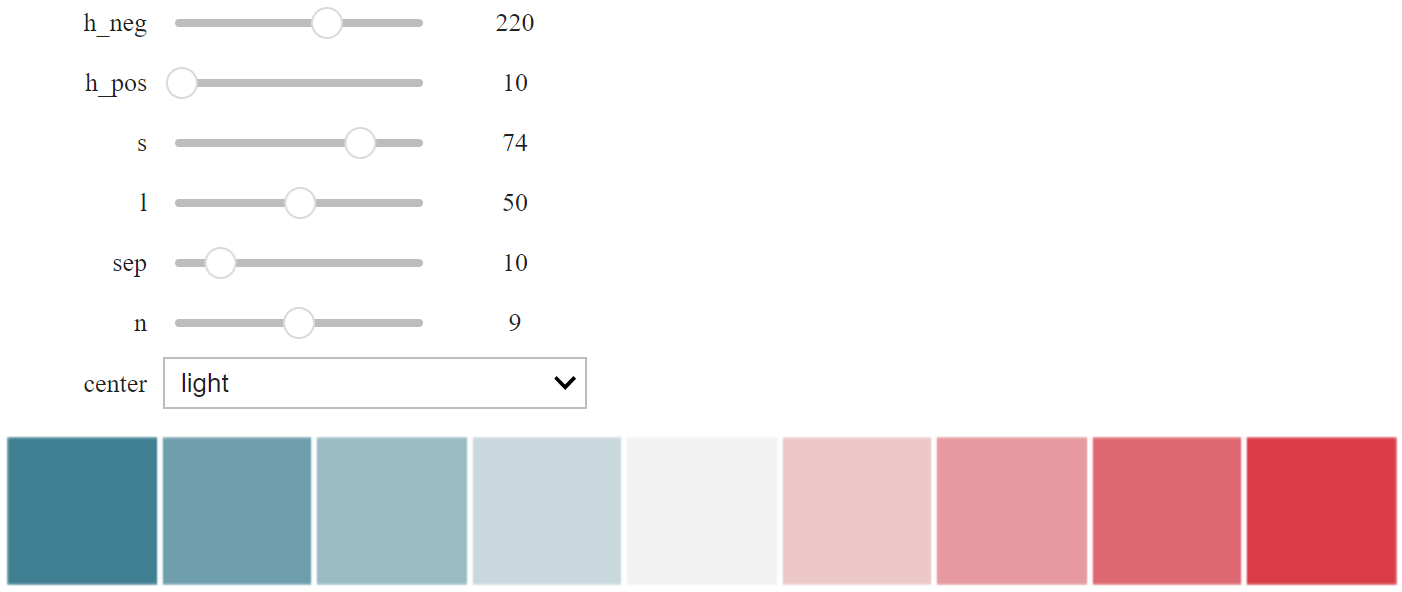
diverging调色板
seaborn.diverging_palette — seaborn 0.13.2 documentation
seaborn.choose_diverging_palette — seaborn 0.13.2 documentation
创建两个 HUSL 颜色之间的diverging调色板,适用于 离散型数据 。适用于 数据范围在有趣的低值和有趣的高值之间 , 并且有一个有意义的中间值(例如,相对于某个基线值的变化分数)。
| diverging_palette | |
|---|---|
- 负向端色调[0, 359]
- 正向端色调[0, 359]
- 饱和度[0, 100]
- 亮度[0, 100]
- 中间区域大小
- 颜色数
- 调色板中心是浅色(“light”)还是深色(“dark”)
- True:返回Colormap对象;False:返回RGB元组列表
| choose_diverging_palette | |
|---|---|
mpl调色板
seaborn.mpl_palette — seaborn 0.13.2 documentation
基于matplotlibl的调色板,构建diverging/sequential 调色板,生成一个离散或者连续的调色板。
当name选择matplotlib中diverging型调色板时,生成也为diverging型;当name选择matplotlib中sequential型调色板时,生成也为sequential型颜色。
| mpl_palette | |
|---|---|
- matplotlib中注册的调色板名称
- 颜色数
- True:返回Colormap对象;False:返回RGB元组列表
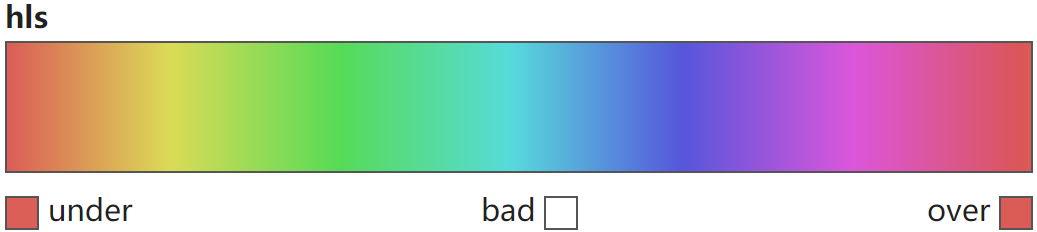
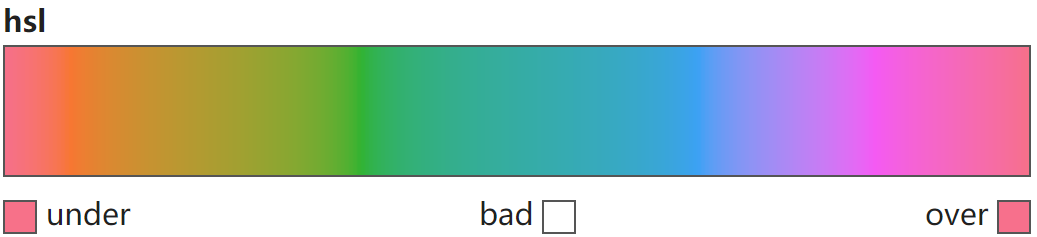
hls调色板和husl调色板
seaborn.hls_palette — seaborn 0.13.2 documentation
seaborn.husl_palette — seaborn 0.13.2 documentation
从HLS颜色系统和HUSL颜色系统构建恒定亮度和饱和度的调色板,适用于分类或循环数据。
HSL颜色系统由色调(Hue)、饱和度(Saturation)和亮度(Lightness)三个要素组成。HUSL(Human-friendly HSL)颜色系统是HSL的改进版本,提供更加人类友好的颜色,HUSL考虑了人眼对颜色的感知方式,更好地平衡了色相、饱和度和亮度之间的关系,这使得在图形和数据可视化中使用HUSL配色更吸人。
| hls_palette | |
|---|---|
- 颜色数
- 色调[0, 1],沿圆形路径均匀采样
- 亮度[0, 1]
- 饱和度[0, 1]
- True:返回Colormap对象;False:返回RGB元组列表
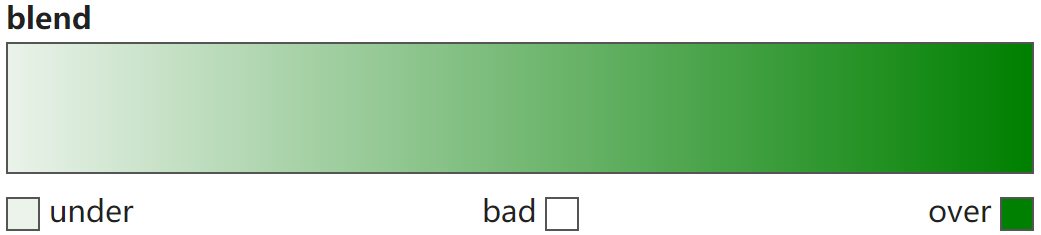
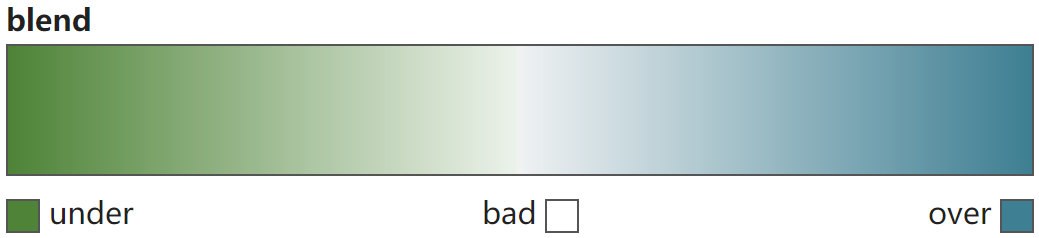
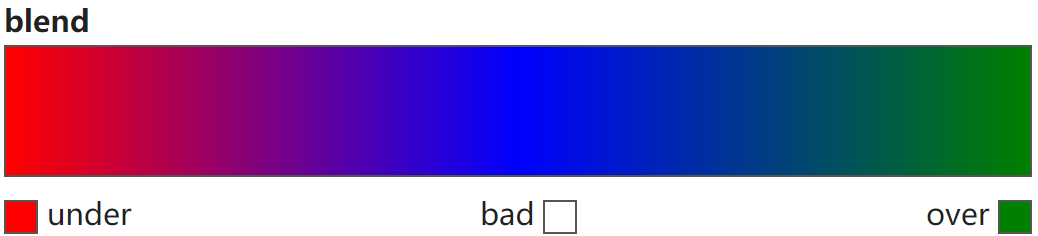
blend调色板
seaborn.blend_palette — seaborn 0.13.2 documentation
创建一个在颜色列表之间混合的调色板。
Note
此外,可以使用以 'blend:<color>,<color>,...' 字符串生成blend调色板
| blend_palette | |
|---|---|
- 由 input参数解释的多种格式的颜色序列
- 解释color的颜色空间,可选‘rgb’, ‘hls’, ‘husl’, xkcd’
- 颜色数
- True:返回Colormap对象;False:返回RGB元组列表
colorbrewer调色板
seaborn.choose_colorbrewer_palette — seaborn 0.13.2 documentation
选择 ColorBrewer 调色板中的一个。这些调色板内置在 matplotlib 中,可以在许多 seaborn 函数中按名称使用,或者通过传递此函数返回的对象。
| choose_colorbrewer_palette | |
|---|---|
- 数据类型:可选‘sequential’, ‘diverging’, ‘qualitative’
- True:返回Colormap对象;False:返回RGB元组列表
crayon调色板
seaborn.crayon_palette — seaborn 0.13.2 documentation
创建一个使用 Crayola 蜡笔颜色名称的调色板。颜色取自List_of_Crayola_crayon_colors。
| crayons | |
|---|---|
| crayon_palette | |
|---|---|
- crayons字典中颜色的列表
xkcd调色板
seaborn.xkcd_palette — seaborn 0.13.2 documentation
创建一个包含 xkcd 颜色调查中颜色名称的调色板。
| xkcd_rgb | |
|---|---|
| xkcd_palette | |
|---|---|
- xkcd_rgb字典中颜色的列表

注册调色板
Creating Colormaps in Matplotlib — Matplotlib 3.10.0 documentation
matplotlib.cm — Matplotlib 3.10.0 documentation
matplotlib.cm — Matplotlib 3.10.0 documentation
将自定义的调色板进行注册,加入mpl.colormaps()列表中,可以实现像内置调色板的调用方式,如直接使用名称、使用mpl.colormaps[my_map]等。通过使用mpl.colormaps.register实现,其中name参数设置名称,默认使用自定义调色板自身的名称;force参数设置是否能够重写已有的调色板,默认为False,即只允许添加不允许重写。
通过mpl.colormaps.unregister从注册调色板中移除注册的自定义调色板(注意!无法移除模块本身内置的调色板)。

调色板反转(reversed)
Creating Colormaps in Matplotlib — Matplotlib 3.10.0 documentation
matplotlib.colors.Colormap — Matplotlib 3.10.0 documentation
matplotlib.colors.ListedColormap — Matplotlib 3.10.0 documentation
matplotlib.colors.LinearSegmentedColormap — Matplotlib 3.10.0 documentation
内置调色板中名称后加了"_r"的即为对应调色板的反转版本。或者通过对已有Colormap对象使用.reversed(name=None),其中name参数为反转的Colormap对象设置名称,默认为原名称+"_r"。
| 反转调色板(Reversed colormaps) | |
|---|---|

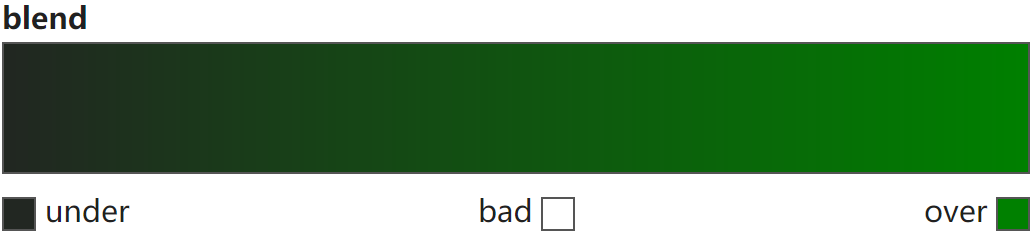
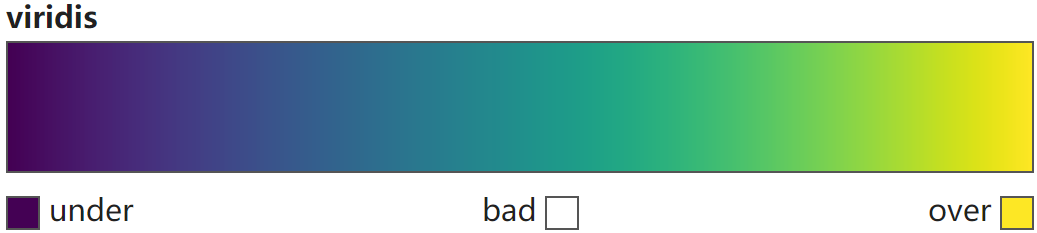
Colormap对象颜色值获取(索引)
Creating Colormaps in Matplotlib — Matplotlib 3.10.0 documentation
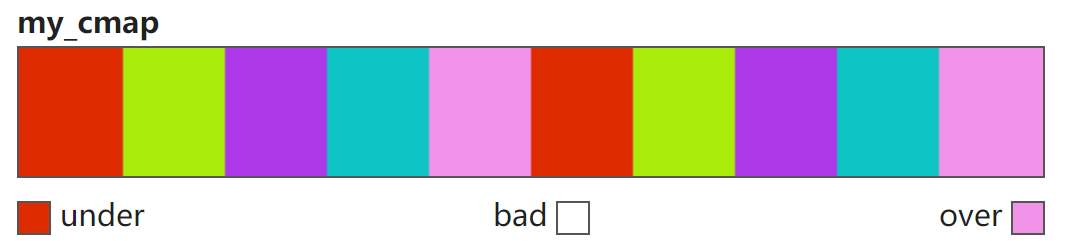
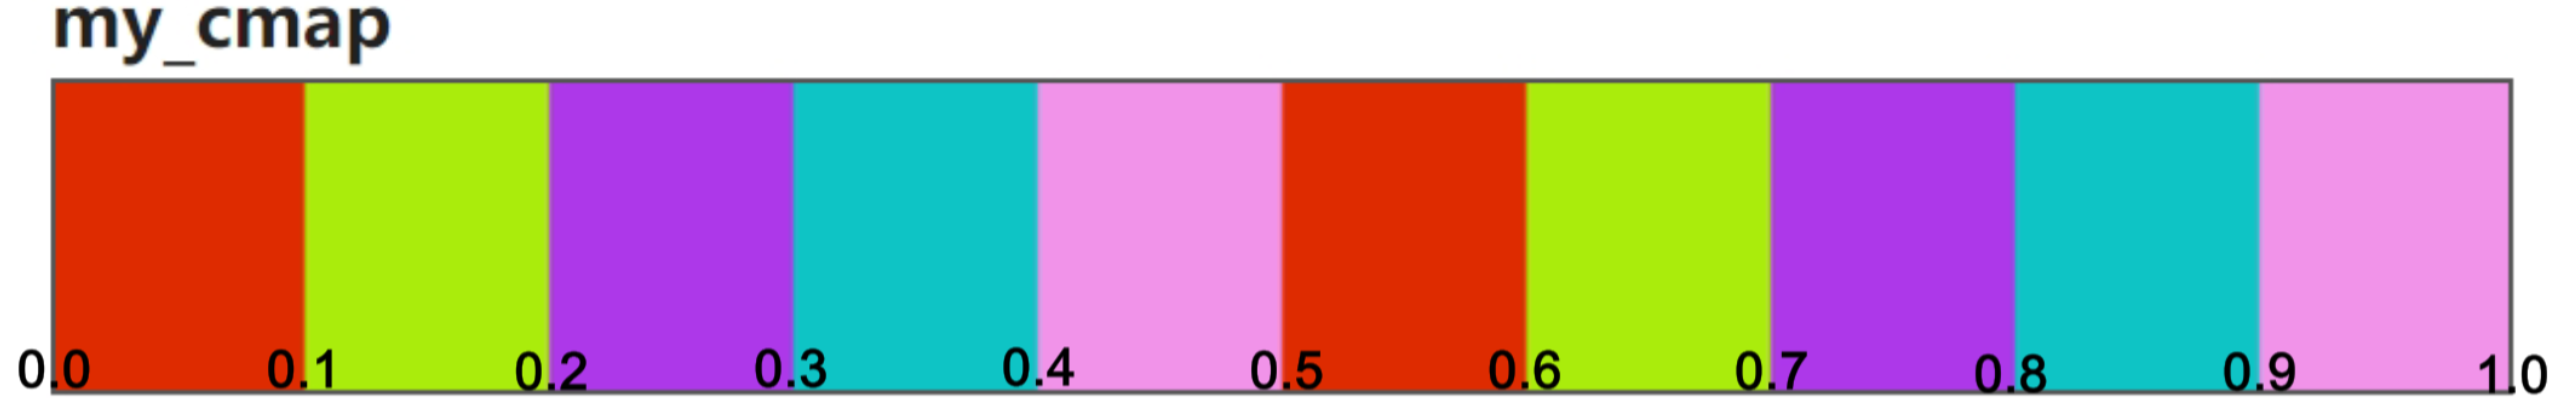
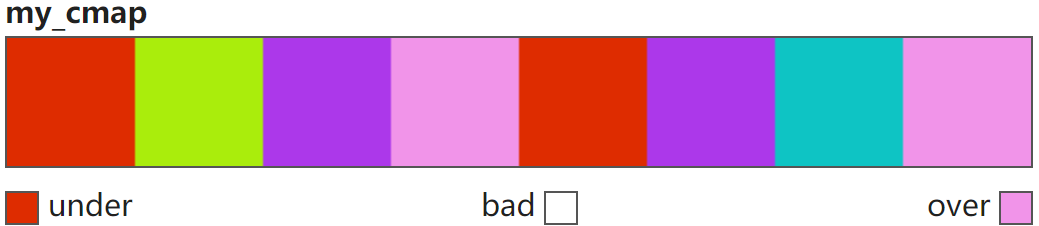
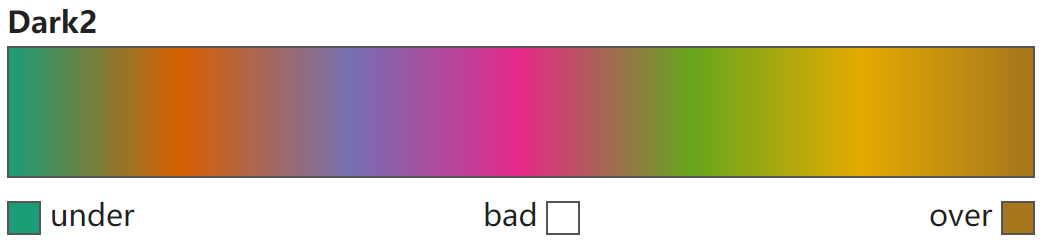
获取Colormap对象的颜色值,尤其是获得其颜色值的RGBA数组,可以方便的将不同的调色板组合(如数组的拼接等方式),从而更方便地创建调色板。同时,Colormap内部颜色值的索引也是具体数据对应到颜色值的方式。
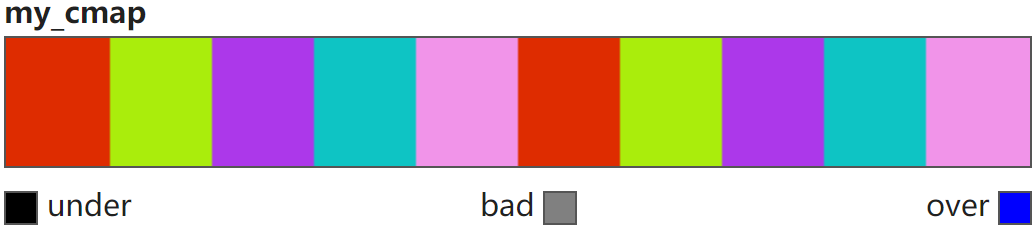
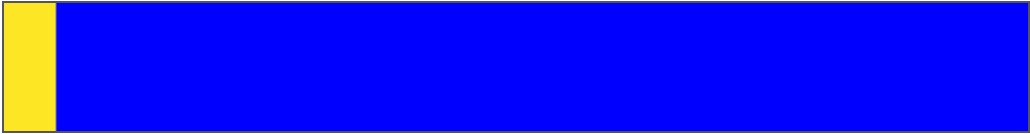
Colormap索引时超范围索引对应的颜色值由under和over定义,默认情况下为范围内的两端颜色值(如上),可以通过set_under(color='k', alpha=None)、set_over(color='k', alpha=None)来设置。
索引时被掩码(masked)的值【无效值或缺失值, 如np.nan以及掩码数组中被掩码的值】对应的颜色值则由bad定义,默认为白色(如上),可以通过set_bad(color='k', alpha=None)来设置。
以上均可通过set_extremes(bad=None, under=None, over=None)来设置。
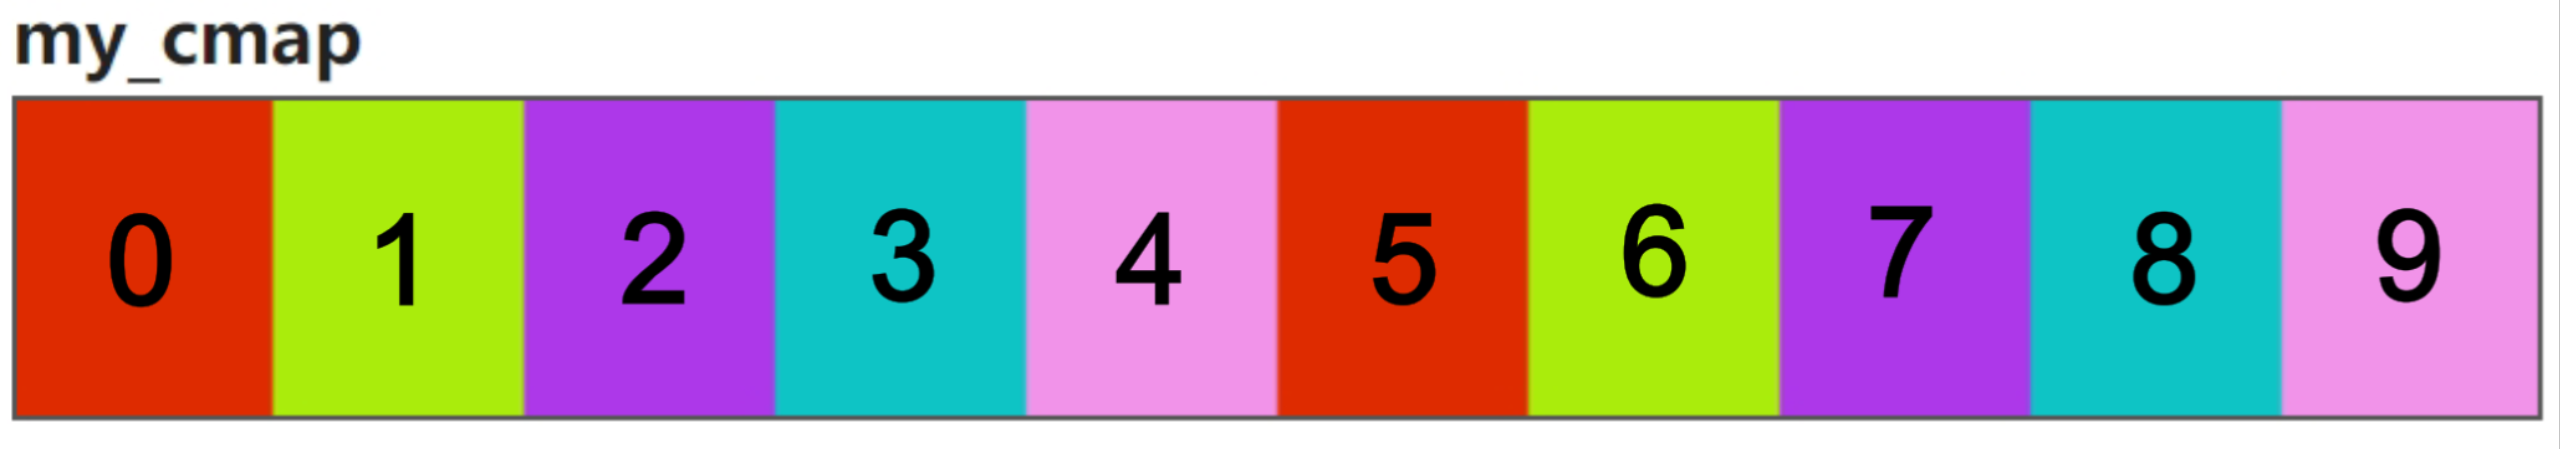
| my_cmap | |
|---|---|
-
.colors仅用于ListedColormap对象,输出其范围内包含的所有颜色值(字符串或RGBA列表)组成的列表
-
整数
将Colormap对象视为一个颜色列表,从而可以类似列表通过 0~N 的整数实现对其颜色值进行索引(超索引值按under和over取),返回颜色值RGBA数组。
一般索引 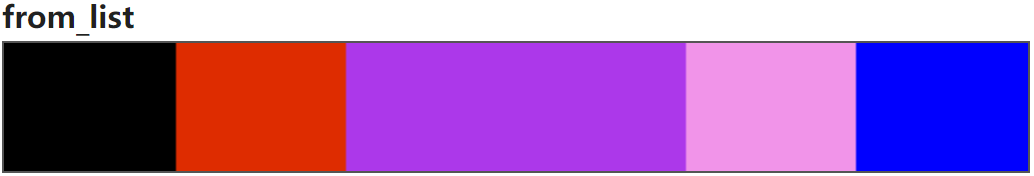
-
浮点数
将Colormap对象视为一个从 0.0~1.0 的颜色尺,每一个浮点数落在哪一个颜色区间内(左闭右开)即索引该颜色值(超索引值按under和over取),返回颜色值RGBA数组。在索引列表中只要有一个浮点数,则均视为浮点数,按浮点数方式索引。(注意np.nan、np.inf这些均是浮点数类型)。
一般索引 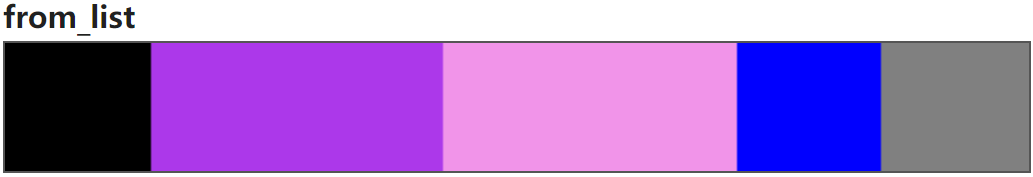
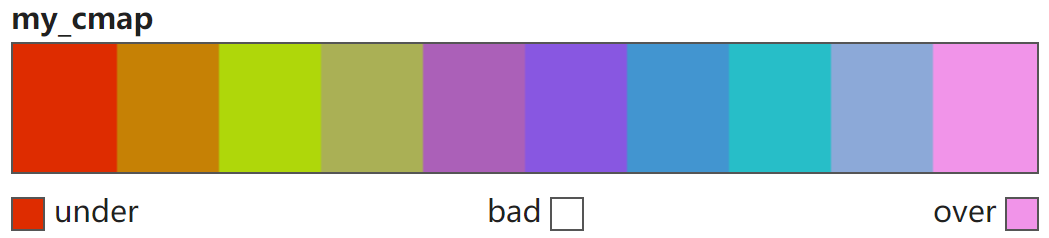
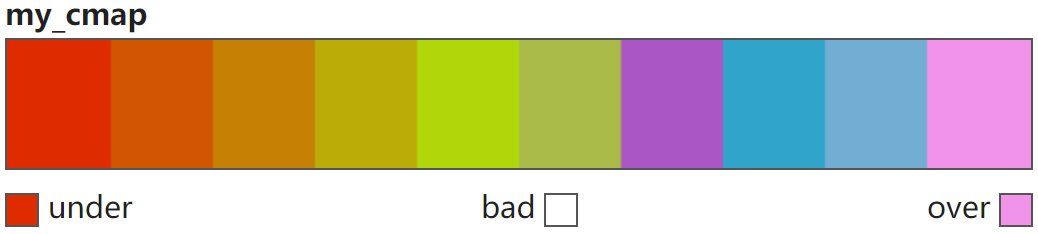
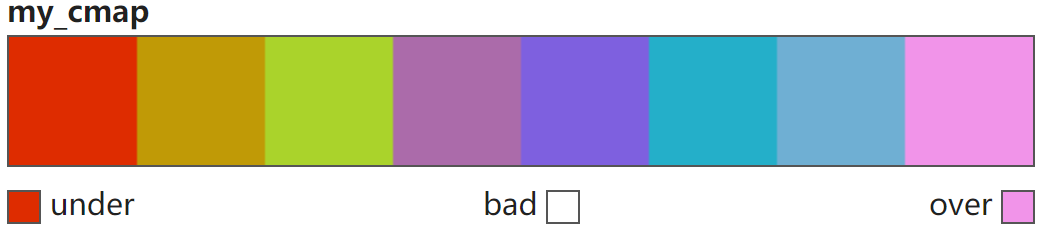
调色板重采样(resampled)
Creating Colormaps in Matplotlib — Matplotlib 3.10.0 documentation
matplotlib.colors.Colormap — Matplotlib 3.10.0 documentation
matplotlib.colors.ListedColormap — Matplotlib 3.10.0 documentation
matplotlib.colors.LinearSegmentedColormap — Matplotlib 3.10.0 documentation
通过.resampled(lutsize)从Colormap对象中等间隔索引取lutsize个颜色组成一个新的Colormap对象。
归一化映射
Colormap normalization — Matplotlib 3.10.0 documentation
Colormap normalizations — Matplotlib 3.10.1 documentation
如前,[0, 1]的数据可以直接通过colormap索引映射到对应的颜色,但大多数时候使用的数据并不都在[0, 1]内,若直接索引将会出现大量的under或over色值,无法区分数据,这时就需要将数据进行归一化。该过程首先将输入数据归一化到[0, 1],然后再映射到颜色图中的索引。
不归一化(NoNorm)
matplotlib.colors.NoNorm — Matplotlib 3.10.1 documentation
mpl.colors.NoNorm()
线性归一化
适用于 线性均匀分布的数据 。
matplotlib.colors.Normalize — Matplotlib 3.10.0 documentation
#mpl.colors.Normalize(vmin=None, vmax=None, clip=False)
将数据从[vmin, vmax]线性归一化到[0, 1]。
\(Norm(x) = {x - v_{min} \over {v_{max}-v_{min}}}\)
clip参数决定映射时[vmin, vmax]外数据的映射方式,默认False,则按超范围索引进行映射(under或over)。若为True,则直接按0或1进行映射。


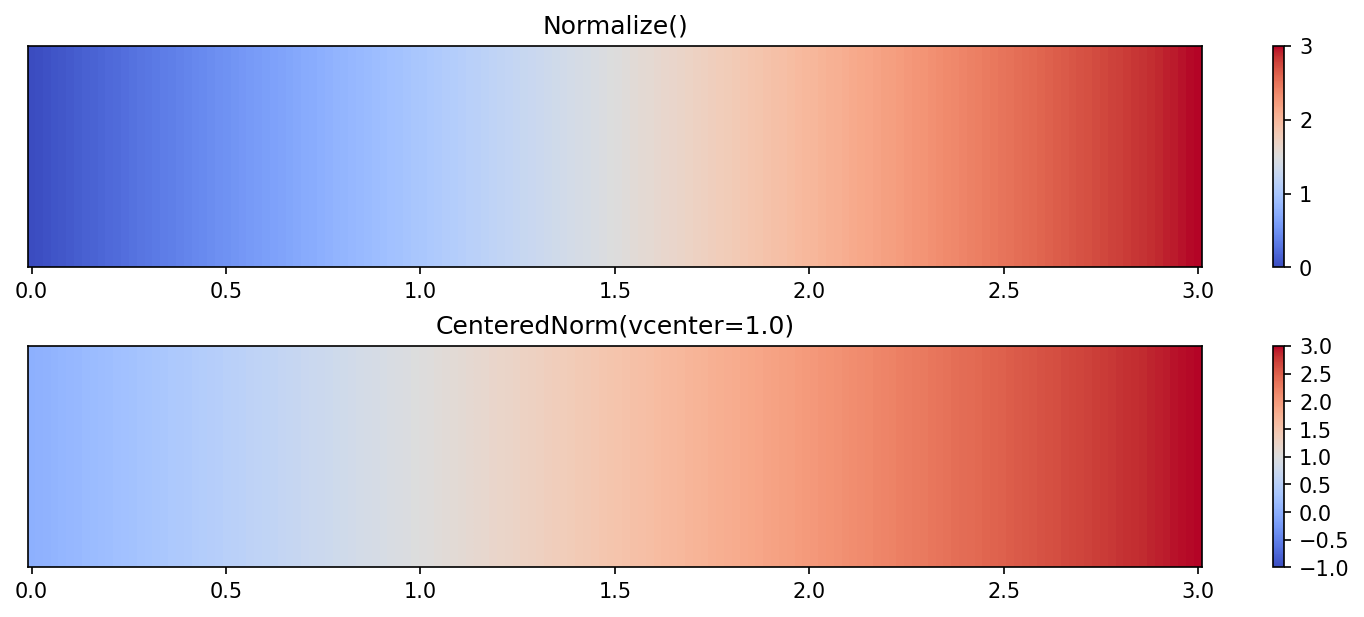
matplotlib.colors.CenteredNorm — Matplotlib 3.10.1 documentation
mpl.colors.CenteredNorm(vcenter=0, halfrange=None, clip=False)
将数据从[vcenter-halfrange, vcenter+halfrange]线性归一化到[0, 1],以vcenter为中心,两侧变化率相同。
\(Norm(x) = {x - (vcenter-halfrange) \over {2 \times halfrange}}\)
matplotlib.colors.TwoSlopeNorm — Matplotlib 3.10.1 documentation
mpl.colors.TwoSlopeNorm(vmin=None, vcenter=None, vmax=None)
将数据从[vmin, vcenter]线性归一化到[0, 0.5],从[vcenter, vmax]线性归一化到[0.5, 1],以vcenter为中心,两侧变化率不同。
\(Norm(x) = \begin{cases} {x-v_{min} \over 2(v_{center}-v_{min})} & x \in [vmin, vcenter] \\{x-(v_{max}-v_{center}) \over 2(v_{max}-v_{center})} & x \in [vcenter, vmax]\end{cases}\)
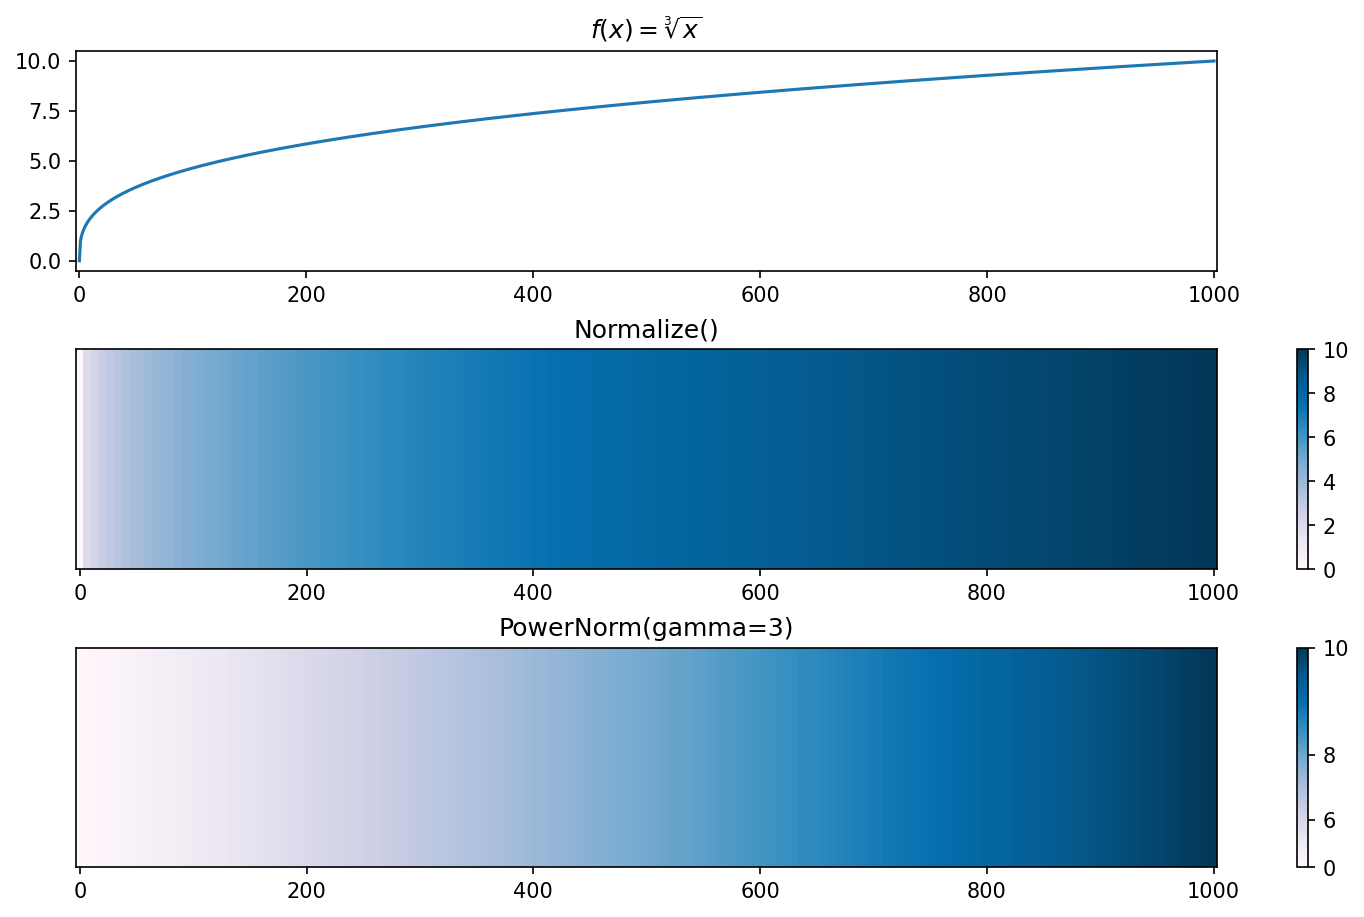
幂律归一化(PowerNorm)
matplotlib.colors.PowerNorm — Matplotlib 3.10.1 documentation
mpl.colors.PowerNorm(gamma, vmin=None, vmax=None, clip=False)
将数据从[vmin, vmax]线性归一化到[0, 1]后再应用幂律γ(对于<vmin的值γ=1),适用于 符合幂律分布(长尾分布) 的数据
\(Norm(x) = ({x - v_{min} \over {v_{max}-v_{min}}})^{\gamma}\)
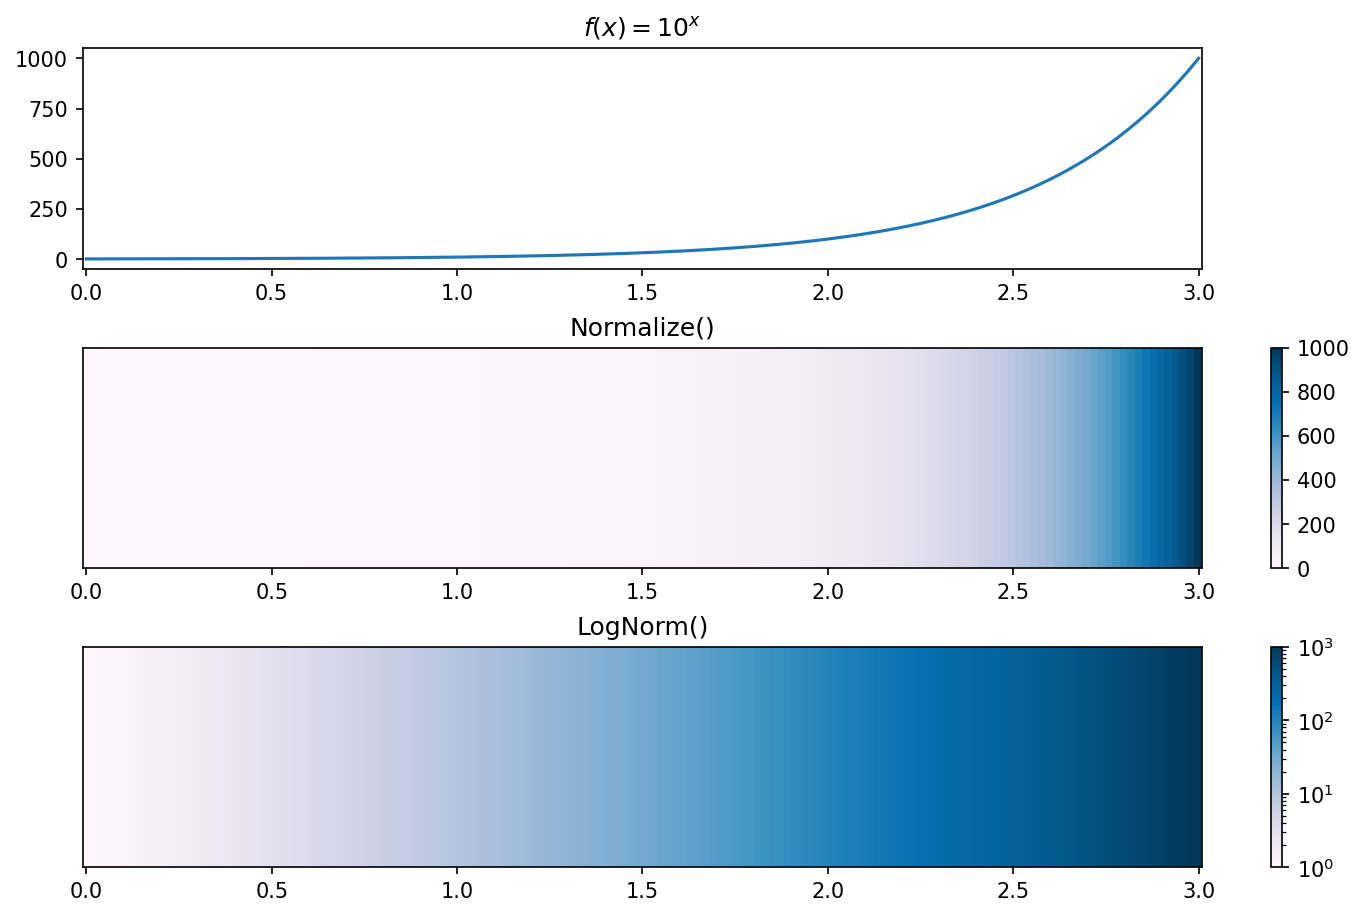
对数归一化(LogNorm)
matplotlib.colors.LogNorm — Matplotlib 3.10.1 documentation
mpl.colors.LogNorm(vmin=None, vmax=None, clip=False)
将数据从[vmin, vmax]按对数尺度归一化到[0, 1],适用于 跨越多个(正数)数量级(指数变化)的数据
\(Norm(x) = {{\log_{}{x} - \log_{}{v_{min}}} \over {\log_{}{v_{max}} - \log_{}{v_{min}}}}\)
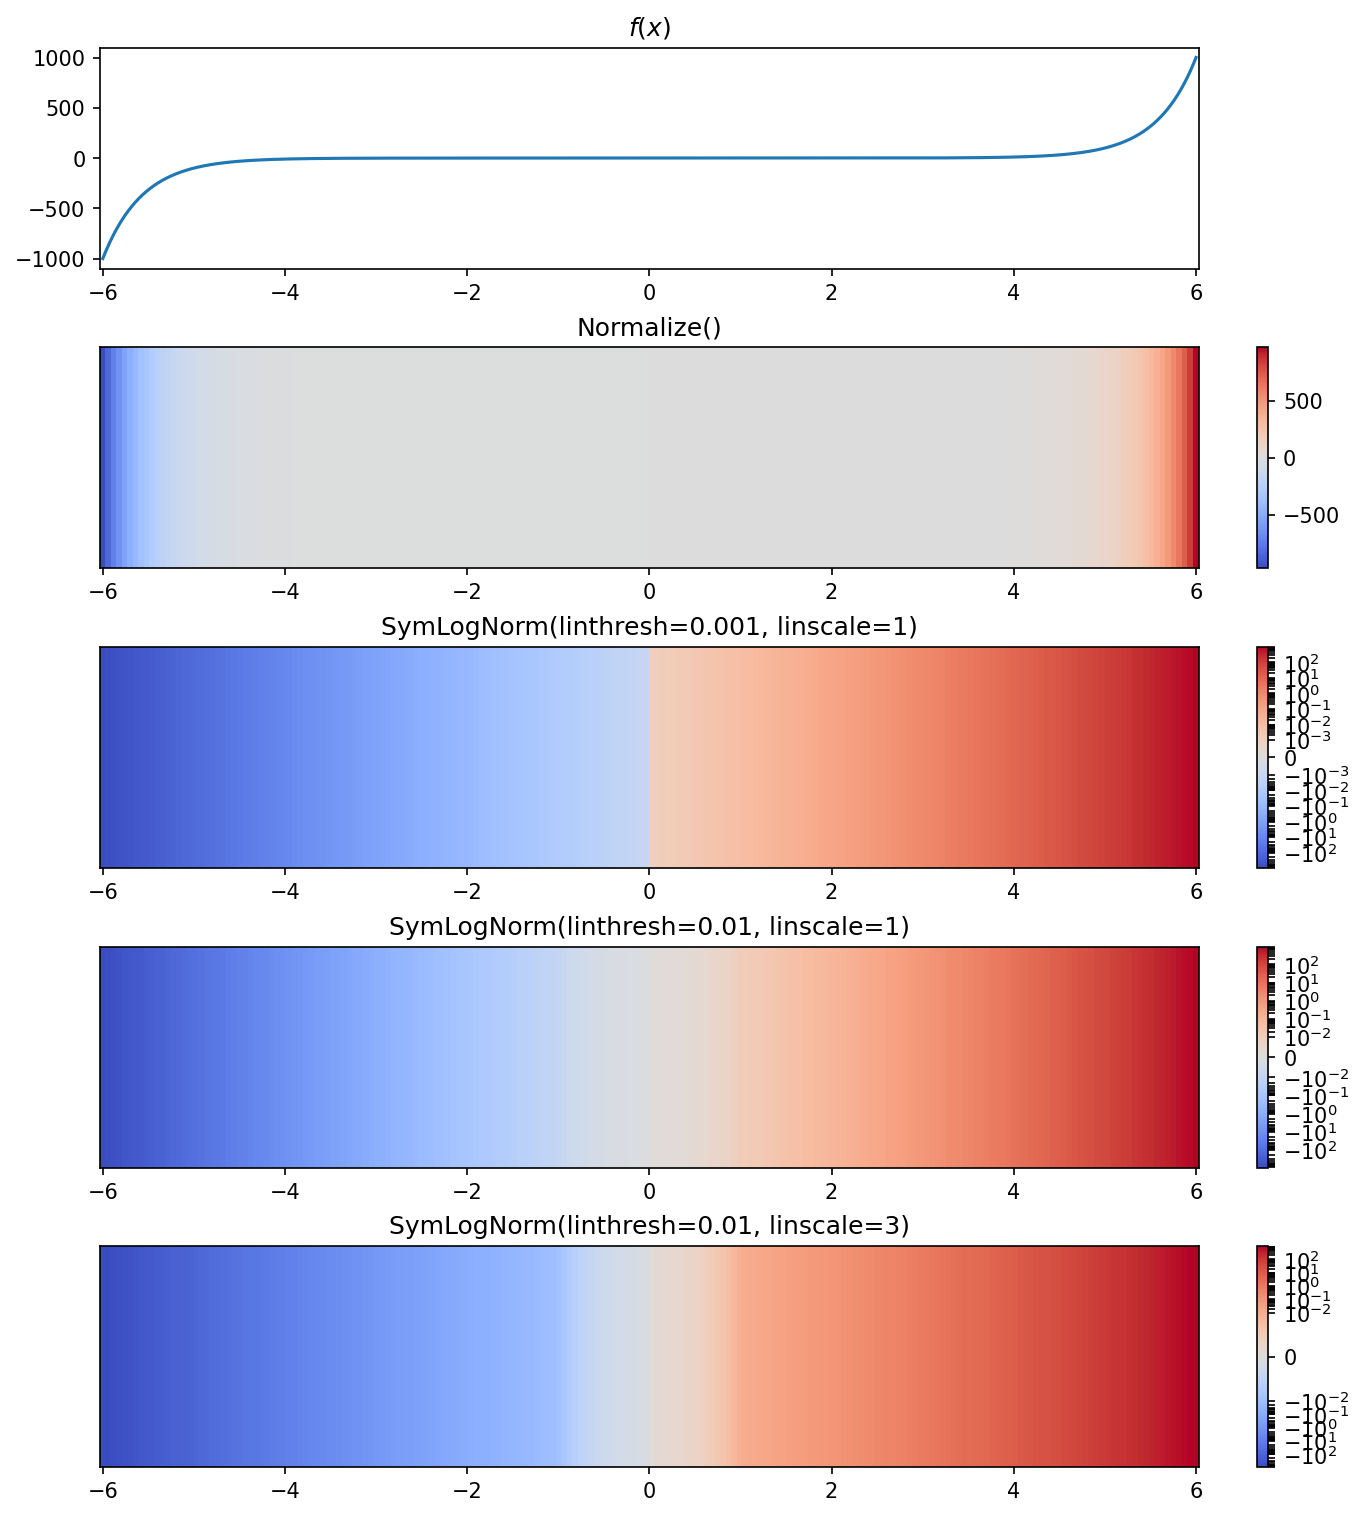
对称对数归一化(SymLogNorm)
matplotlib.colors.SymLogNorm — Matplotlib 3.10.1 documentation
mpl.colors.SymLogNorm(linthresh, linscale=1.0, vmin=None, vmax=None, clip=False, base=10)
将数据从[vmin, vmax]按对称对数尺度归一化到[0, 1]。该方法使得在正负方向上都是对数尺度。由于接近零的值趋向于无穷大,因此需要有一个围绕零的线性映射范围(-linthresh, linthresh)。linscale允许线性范围相对于对数范围进行拉伸,它的值是线性范围的每一半(1)占对数范围(base)的比例。适用于 包含正负值且跨度大(双向指数变化)的数据
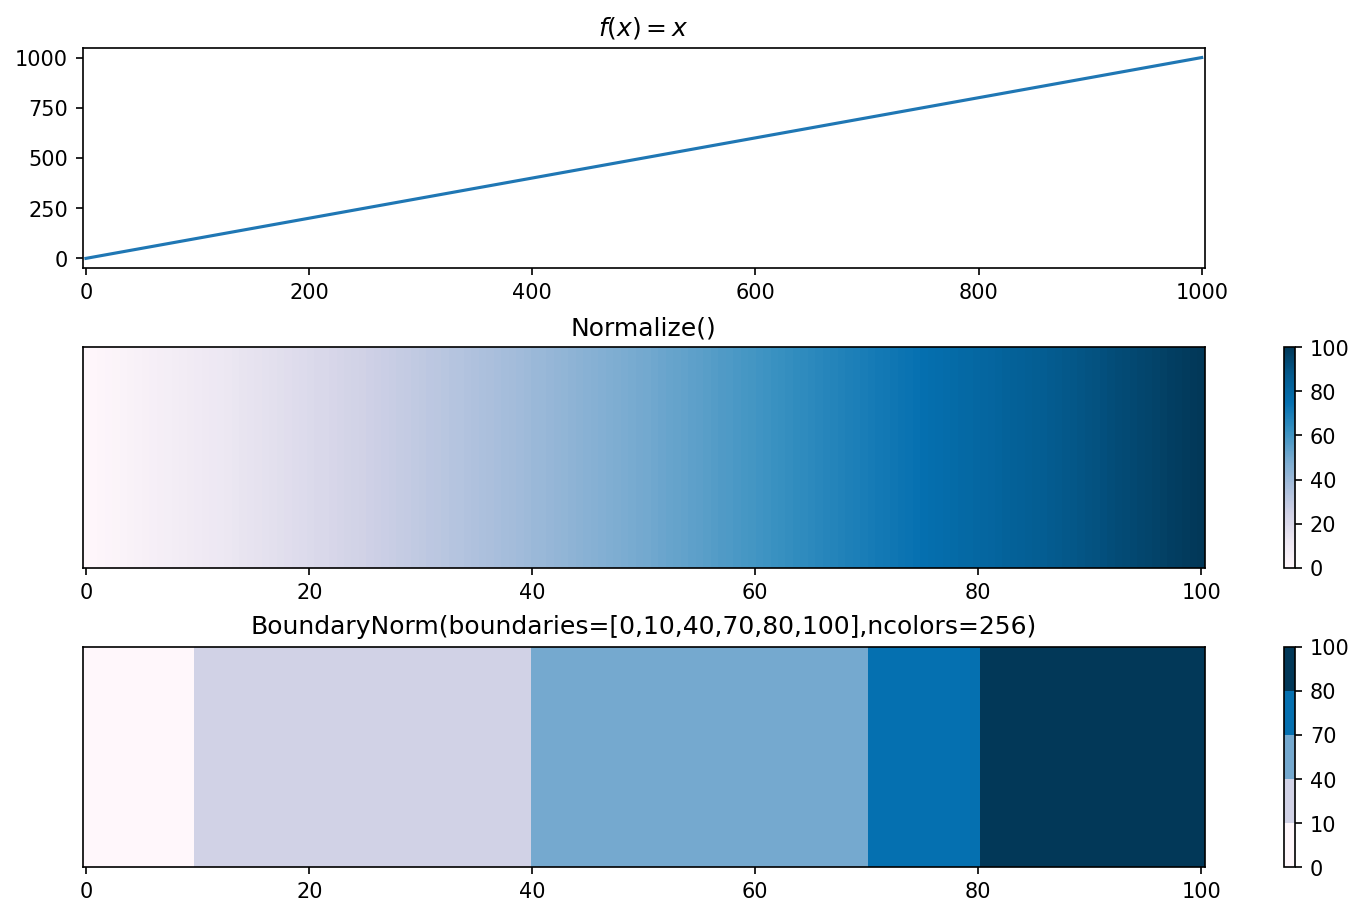
区间归一化(BoundaryNorm)
matplotlib.colors.BoundaryNorm — Matplotlib 3.10.1 documentation
mpl.colors.BoundaryNorm(boundaries, ncolors, clip=False, *, extend='neither')
根据离散区间生成colormap索引。不同于 Normalize 或 LogNorm , BoundaryNorm 将值映射到整数,而不是映射到[0, 1]的区间。它将数据分为多个区间(左闭右开),根据ncolors为每个区间分配相对均匀分布的整数值,落在该区间的数据将映射到colormap的整数值索引对应的颜色。
第三方调色板
Palettable
| 安装 | |
|---|---|
| 其它方法 | |
|---|---|


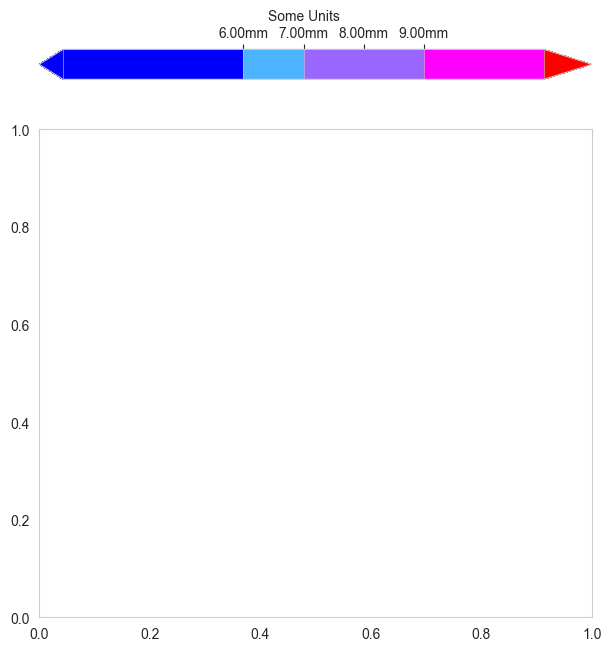
颜色条(colorbar)
Customized Colorbars Tutorial — Matplotlib 3.10.0 documentation
matplotlib.colorbar — Matplotlib 3.10.1 documentation
matplotlib.figure.Figure.colorbar — Matplotlib 3.10.1 documentation
matplotlib.pyplot.colorbar — Matplotlib 3.10.1 documentation
- 绘制在哪个Axes上
- 方向, 可选:
- 'vertical'(location必须为'left', 'right')
- 'horizontal'(location必须为'top', 'bottom')
- 位置, 可选:
- 'left'
- 'right'【orientation=None/'vertical'时默认】
- 'top'
- 'bottom'【orientation='horizontal'时默认】
- 超范围值延伸:可选'neither'(默认), 'both', 'min', 'max'
- 延伸形状:True为矩形,False为三角形(默认)
- 延伸比例:默认None(5%),可选'auto', 比例, (比例, 比例)
- 标签
- 刻度位置, 可选:
- 'auto'【同location参数】
- 'left'
- 'right'【仅orientation='vertical',默认'right'】
- 'top'
- 'bottom'【仅orientation='horizontal',默认'bottom'】
- 刻度定位器或刻度列表
- 刻度标签格式化器或直接接受格式化字符串
- 区间
- 区间值
- 是否绘制颜色区间边界线
- 区间空间分配:可选'uniform'(均匀), 'proportional'(数据间隔比例)
- 当cax参数未指定时,从哪个或哪些Axes(父Axes)腾出空间创建一个新的Axes(子Axes)来绘制
- 方向, 可选:
- 'vertical'(location必须为'left', 'right')
- 'horizontal'(location必须为'top', 'bottom')
- 位置, 可选:
- 'left'
- 'right'【orientation=None/'vertical'时默认】
- 'top'
- 'bottom'【orientation='horizontal'时默认】
- 与ax间距比例:默认0.05【orientation='vertical'】,或0.15【orientation='horizontal'】
- 子Axes锚点:默认(0.0, 0.5)【orientation='vertical'】,或(0.5, 1.0)【orientation='horizontal'】
- 父Axes锚点:默认(1.0, 0.5)【orientation='vertical'】,或(0.5, 0.0)【orientation='horizontal'】
- 占Axes比例
- 缩放比例:默认1.0
- 长宽比:默认20
- 超范围值延伸:可选'neither'(默认), 'both', 'min', 'max'
- 延伸形状:True为矩形,False为三角形(默认)
- 延伸比例:默认None(5%),可选'auto', 比例, (比例, 比例)
- 标签
- 刻度位置, 可选:
- 'auto'【同location参数】
- 'left'
- 'right'【仅orientation='vertical',默认'right'】
- 'top'
- 'bottom'【仅orientation='horizontal',默认'bottom'】
- 刻度定位器或刻度列表
- 刻度标签格式化器或直接接受格式化字符串
- 区间
- 区间值
- 是否绘制颜色区间边界线
- 区间空间分配:可选'uniform'(均匀), 'proportional'(数据间隔比例)