| 导入模块与数据准备 |
|---|
| import matplotlib as mpl
import matplotlib.pyplot as plt
import numpy as np
x = np.arange(0, 100, 1)
"""
[ 0 1 2 3 4 5 6 7 8 9 10 11 12 13 14 15 16 17 18 19 20 21 22 23 24 25 26 27 28 29 30 31 32 33 34 35 36 37 38 39 40 41 42 43 44 45 46 47 48 49 50 51 52 53 54 55 56 57 58 59 60 61 62 63 64 65 66 67 68 69 70 71 72 73 74 75 76 77 78 79 80 81 82 83 84 85 86 87 88 89 90 91 92 93 94 95 96 97 98 99]
"""
y = np.sin(x)
"""
[ 0. 0.84147098 0.90929743 0.14112001 -0.7568025 -0.95892427 -0.2794155 0.6569866 0.98935825 0.41211849 -0.54402111 -0.99999021 -0.53657292 0.42016704 0.99060736 0.65028784 -0.28790332 -0.96139749 -0.75098725 0.14987721 0.91294525 0.83665564 -0.00885131 -0.8462204 -0.90557836 -0.13235175 0.76255845 0.95637593 0.27090579 -0.66363388 -0.98803162 -0.40403765 0.55142668 0.99991186 0.52908269 -0.42818267 -0.99177885 -0.64353813 0.29636858 0.96379539 0.74511316 -0.15862267 -0.91652155 -0.83177474 0.01770193 0.85090352 0.90178835 0.12357312 -0.76825466 -0.95375265 -0.26237485 0.67022918 0.98662759 0.39592515 -0.55878905 -0.99975517 -0.521551 0.43616476 0.99287265 0.63673801 -0.30481062 -0.96611777 -0.7391807 0.1673557 0.92002604 0.82682868 -0.02655115 -0.85551998 -0.89792768 -0.11478481 0.77389068 0.95105465 0.25382336 -0.67677196 -0.98514626 -0.38778164 0.56610764 0.99952016 0.51397846 -0.44411267 -0.99388865 -0.62988799 0.31322878 0.96836446 0.73319032 -0.17607562 -0.92345845 -0.82181784 0.0353983 0.86006941 0.89399666 0.10598751 -0.77946607 -0.94828214 -0.24525199 0.68326171 0.98358775 0.37960774 -0.57338187 -0.99920683]
"""
|
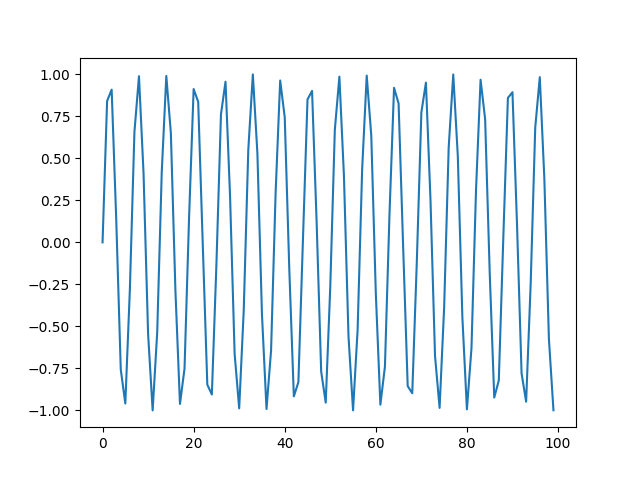
| 默认Figure与Axes |
|---|
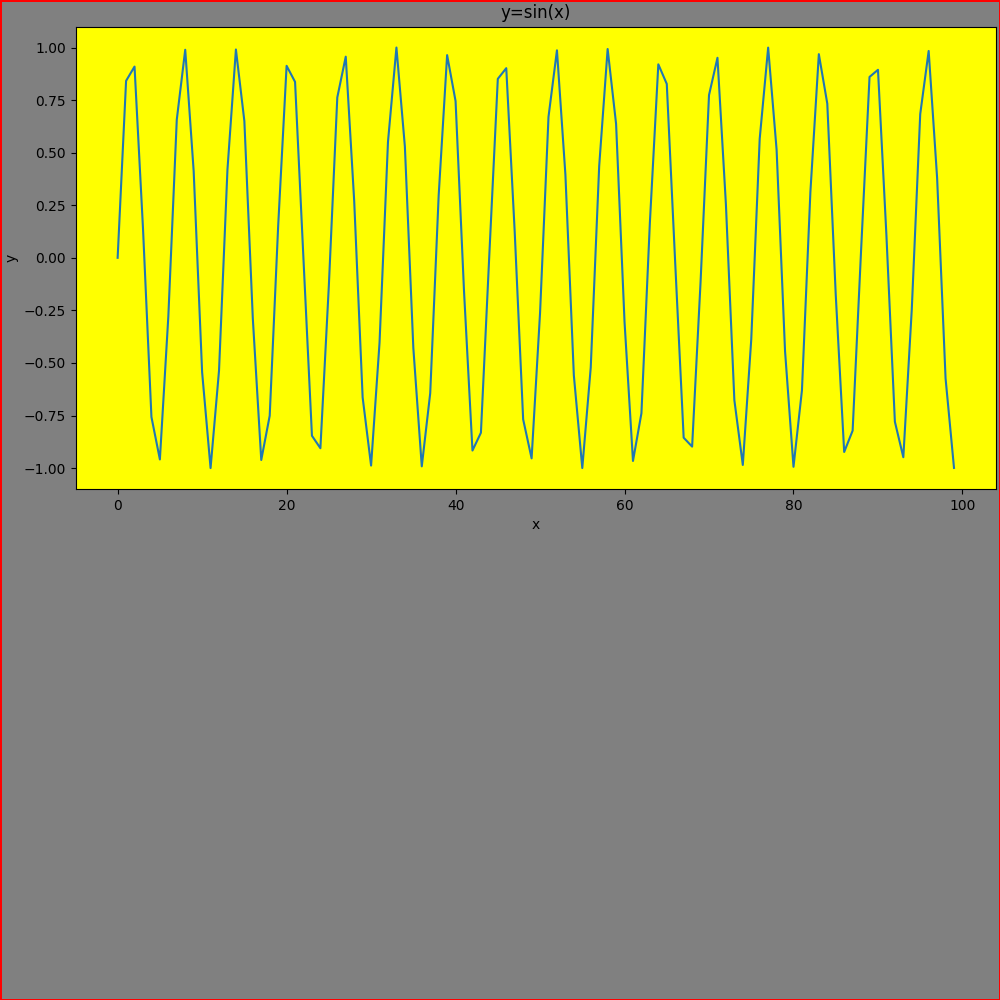
| # ax = plt.gca() # 获取当前激活的Axes
plt.plot(x, y)
plt.show()
|
matplotlib.figure.Figure — Matplotlib 3.10.1 documentation
matplotlib.pyplot.figure — Matplotlib 3.10.1 documentation
matplotlib.figure — Matplotlib 3.10.1 documentation
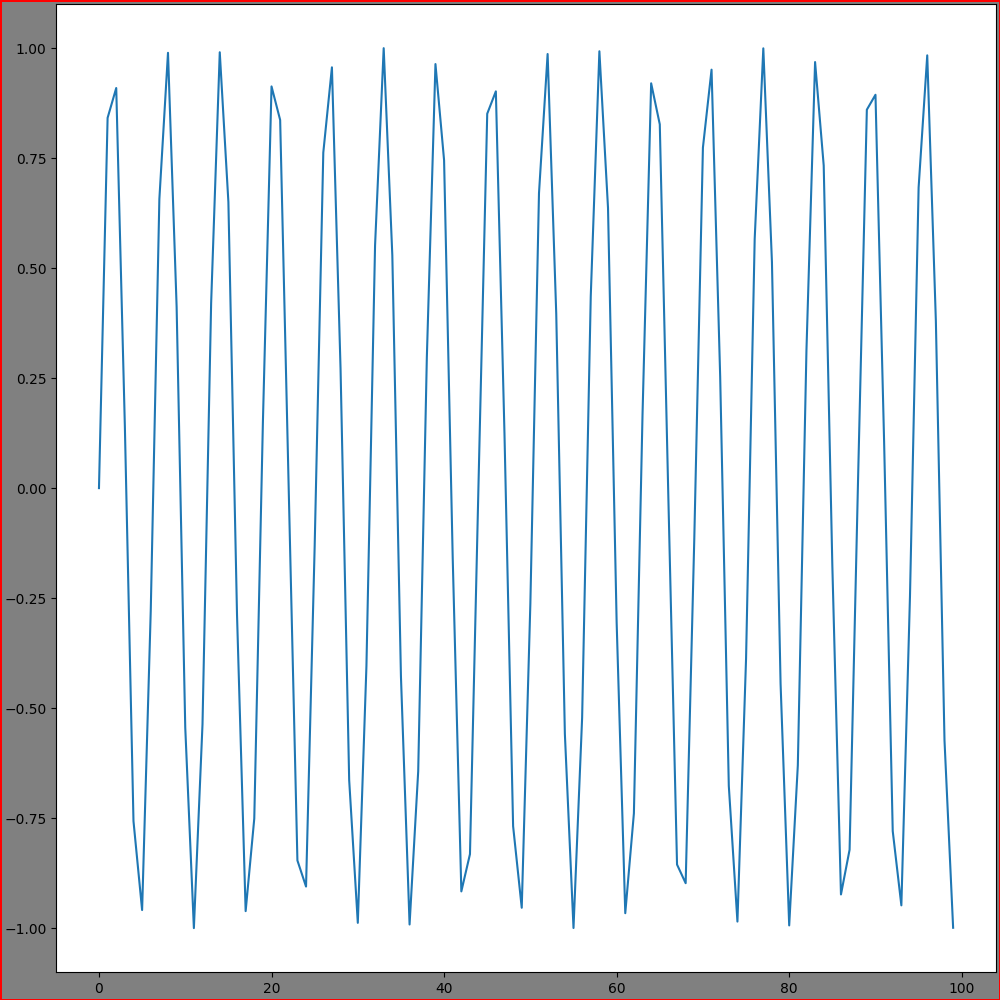
| Figure的设置 |
|---|
| fig = plt.figure(num=None, # (1)!
label="a", # (2)!
clear=False, # (3)!
figsize=(10, 10), # (4)!
dpi=100.0, # (5)!
frameon=True, # (6)!
facecolor='gray', # (7)!
edgecolor='red', # (8)!
linewidth=2.0, # (9)!
layout="constrained" # (10)!
)
"""
fig.number: 1
fig.get_label(): a
"""
plt.plot(x, y)
plt.show()
|
-
图形唯一标识(数字或字符串)或已存在的Figure对象、SubFigure对象。
图形对象已存在,则直接激活并返回;否则先创建再激活并返回
-
图形唯一标识(字符串)
- 是否清除已存在的Figure对象,默认False
- 图形尺寸(英寸):(宽, 高),默认
rcParams["figure.figsize"]=(6.4, 4.8)
- 分辨率:每英寸像素点数,越大越清晰,默认
rcParams["figure.dpi"]=100.0
- 是否绘制背景板,默认
rcParams["figure.frameon"]=True
- 背景板色,默认
rcParams["figure.facecolor"]="white"
- 背景板边缘色,默认
rcParams["figure.edgecolor"]="white"
- 背景板边缘宽度
-
布局, 可选:
- "constrained"
- "compressed"
- "tight"
- "none"
- LayoutEngine实例
- None(默认)
Axes的添加与设置
matplotlib.axes.Axes — Matplotlib 3.10.1 documentation
| Axes参数 |
|---|
| projection=None, # (1)!
title="y=sin(x)", # (2)!
facecolor="yellow", # (3)!
frameon=True, # (4)!
adjustable='box', # (5)!
aspect=40, # (6)!
# box_aspect=1, (7)
xlabel="x", # (8)!
xlim=(40, 100), # (9)!
xbound=(40, 100), # (10)!
xscale="linear", # (11)!
xticks=np.arange(20, 110, 10), # (12)!
xticklabels=np.arange(20, 110, 10), # (13)!
sharex=None, # (14)!
ylabel="y", # (15)!
ylim=(-1, 1), # (16)!
ybound=(-1, 1), # (17)!
yscale="linear", # (18)!
yticks=np.arange(-1, 1.5, 0.5), # (19)!
yticklabels=np.arange(-1, 1.5, 0.5), # (20)!
sharey=None, # (21)!
|
-
坐标系类型, 可选:
- None/'rectilinear'(默认)
- 'aitoff'
- 'hammer'
- 'lambert
- 'mollweide
- 'polar'
- '3d'
-
子图标题
- 子图背景色
- 是否绘制子图边框
-
满足aspect的轴调整方式, 可选:
- "box": 默认,数据范围不变,单位长度的数据比例
- "datalim": 物理尺寸不变,数据范围比例
-
x/y,可选"auto", "equal"(相当于1), 浮点数
- 子图高宽比
- x轴标题
- x轴数据范围
- x轴数据范围
- x轴缩放:可选'linear', 'log', 'symlog', 'asinh', 'logit', 'function', 'functionlog'
- x轴刻度
- x轴刻度标签
- 共享x轴的Axes
- y轴标题
- y轴数据范围
- y轴数据范围
- y轴缩放:可选'linear', 'log', 'symlog', 'asinh', 'logit', 'function', 'functionlog'
- y轴刻度
- y轴刻度标签
- 共享y轴的Axes
逐一添加
matplotlib.figure.Figure.add_subplot — Matplotlib 3.10.1 documentation
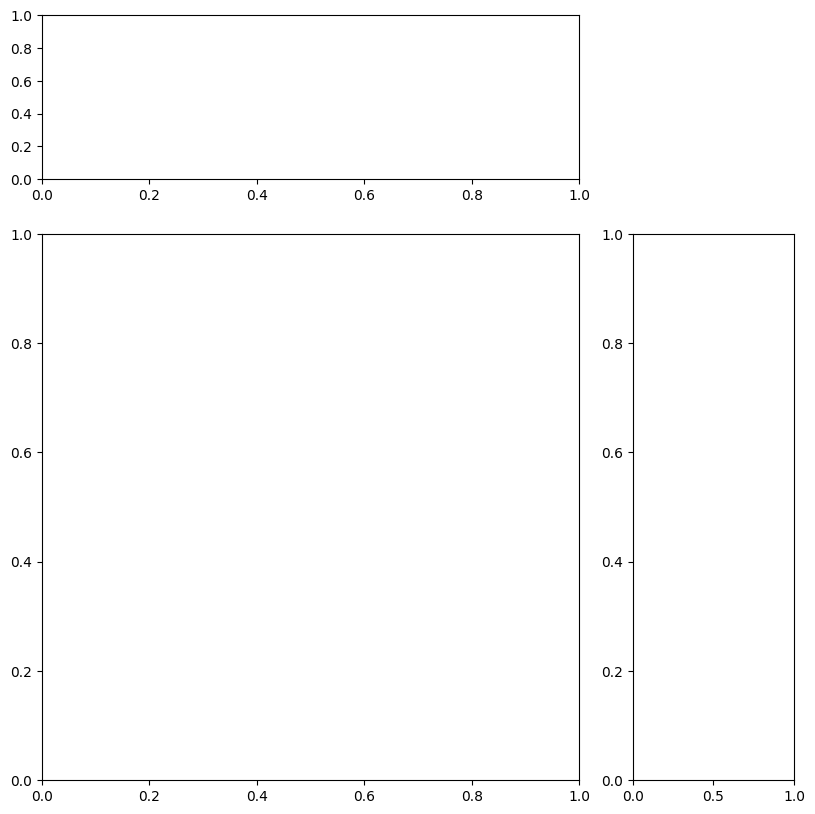
指定位置(网格布局)添加Axes,同时设置Axes参数
| fig.add_subplot(nrows, ncols, index) |
|---|
| ax = fig.add_subplot(2, 2, (1, 2), # (1)!
# Axes参数
title="y=sin(x)",
xlabel="x",
ylabel="y",
facecolor="yellow")
# ax = fig.add_subplot(221) # (2)!
ax.plot(x, y)
plt.show()
|
- (nrows, ncols, index) 或 (nrows, ncols, (first, last))
- 等价于(nrows, ncols, index)

matplotlib.pyplot.subplot — Matplotlib 3.10.1 documentation
同上
| plt.subplot(nrows, ncols, index) |
|---|
| ax = plt.subplot(2, 2, (1, 2), # (1)!
# Axes参数
title="y=sin(x)",
xlabel="x",
ylabel="y",
facecolor="yellow")
# ax = plt.subplot(221) # (2)!
ax.plot(x, y)
plt.show()
|
- (nrows, ncols, index) 或 (nrows, ncols, (first, last))
- 等价于(nrows, ncols, index)
GridSpec布局
matplotlib.gridspec.GridSpec — Matplotlib 3.10.1 documentation
Axes的网格布局
| GridSpec布局 |
|---|
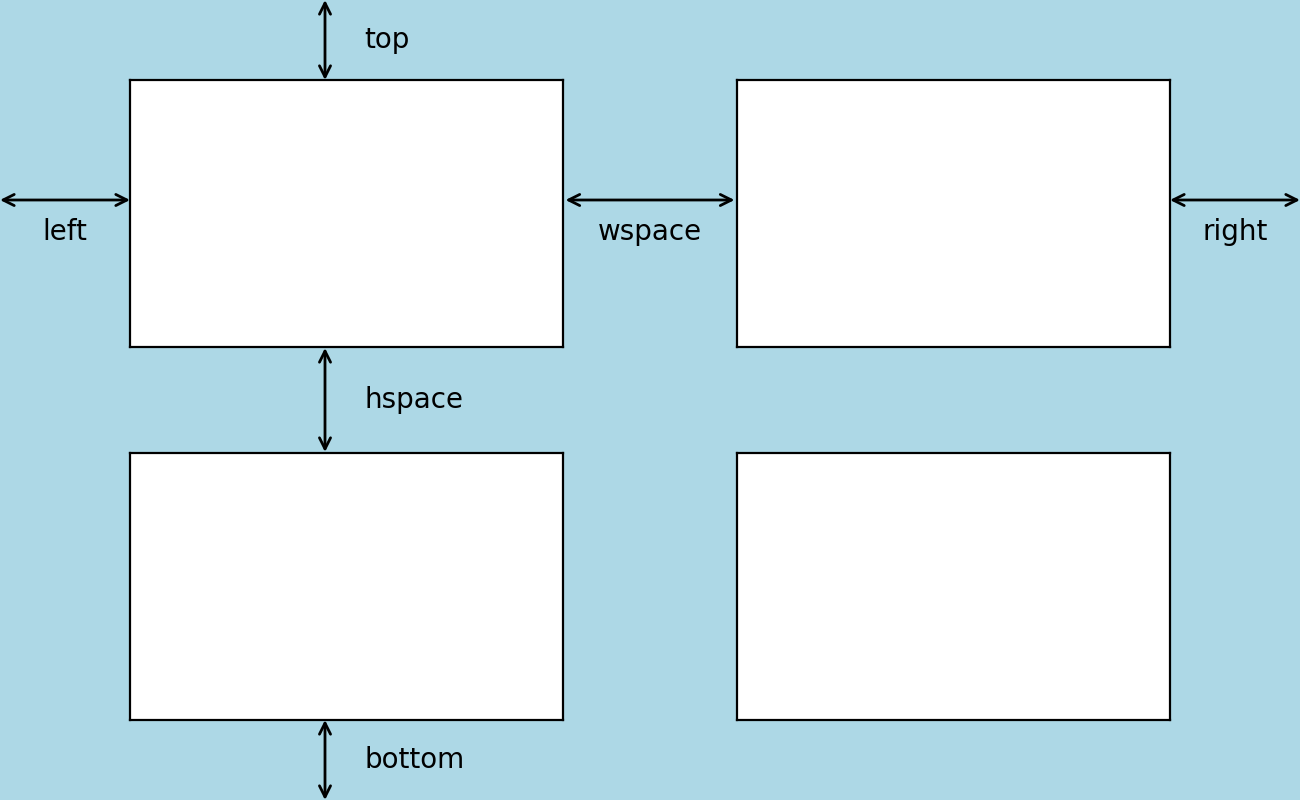
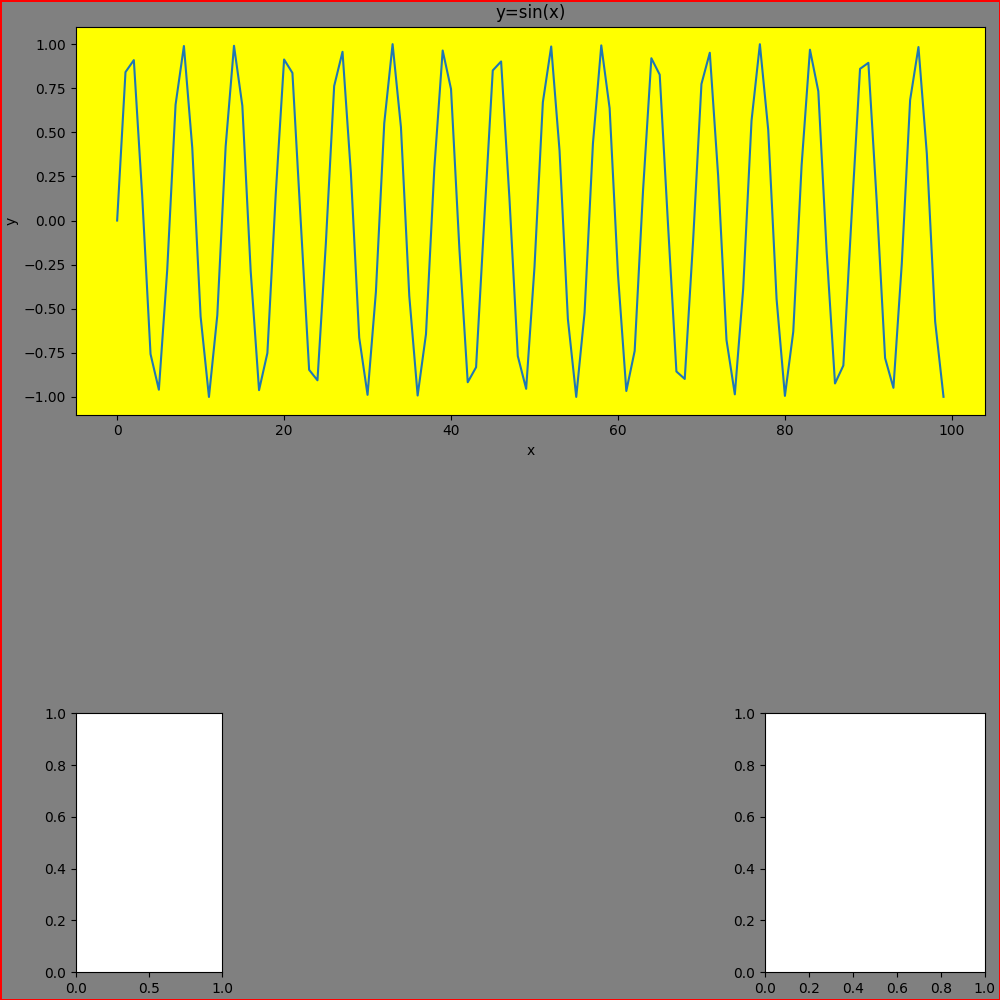
| gs = fig.add_gridspec(nrows=2, ncols=2,
left=0.01, right=0.05, # (1)!
bottom=0.2, top=0.6, # (2)!
wspace=0.5, # (3)!
hspace=0.5, # (4)!
width_ratios=[0.4, 0.6], # (5)!
height_ratios=[0.6, 0.4] # (6)!
)
ax = fig.add_subplot(gs[0, 0:2],
# Axes参数
title="y=sin(x)",
xlabel="x",
ylabel="y",
facecolor="yellow")
ax1 = fig.add_subplot(gs[1, 0])
ax2 = fig.add_subplot(gs[1, 1])
ax.plot(x, y)
plt.show()
|
- 子图左右边距占图形宽的比例。Left<=right
- 子图上下边距占图形高的比例。bottom<=top
- 列间隔(平均轴宽度百分比)
- 行间隔(平均轴高度百分比)
- 每列宽度比例
- 每行高度比例
一次多个
matplotlib.figure.Figure.subplots — Matplotlib 3.10.1 documentation
同时添加多个Axes,返回Axes数组
| fig.subplots(nrows, ncols) |
|---|
| ax_array = fig.subplots(nrows=2,
ncols=2,
sharex="col", # (1)!
sharey="row", # (2)!
squeeze=True, # (3)!
width_ratios=[0.4, 0.6], # (4)!
height_ratios=[0.6, 0.4], # (5)!
subplot_kw={"facecolor": "red"}, # (6)!
gridspec_kw={"wspace": 0.5} # (7)!
)
ax = ax_array[0, 0]
ax.plot(x, y)
plt.show()
|
-
共享x轴, 可选:
- True/'all': 所有子图共享
- False/'none': 不共享
- 'row': 同行共享
- 'col': 同列共享
-
共享y轴, 可选:
- True/'all': 所有子图共享
- False/'none': 不共享
- 'row': 同行共享
- 'col': 同列共享
-
取消返回的子图数组的多余维度
若为False,则返回的子图数组始终为二维数组
-
每列宽度比例,相当于gridspec_kw={"width_ratios": []}
- 每行高度比例,相当于gridspec_kw={"height_ratios": []}
- Axes全局参数
- Gridspec参数
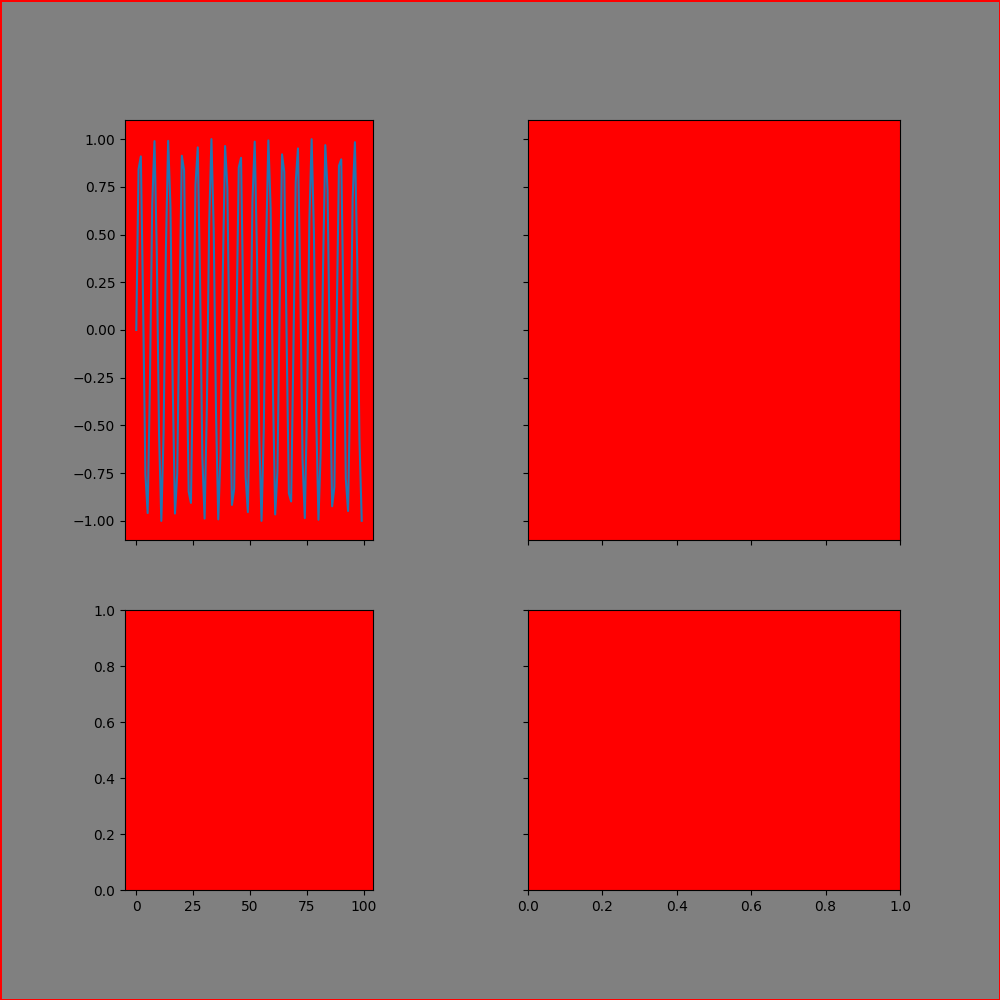
matplotlib.pyplot.subplots — Matplotlib 3.10.1 documentation
同上,但同时返回并激活一个Figure对象(可设置参数)
| plt.subplots(nrows, ncols) |
|---|
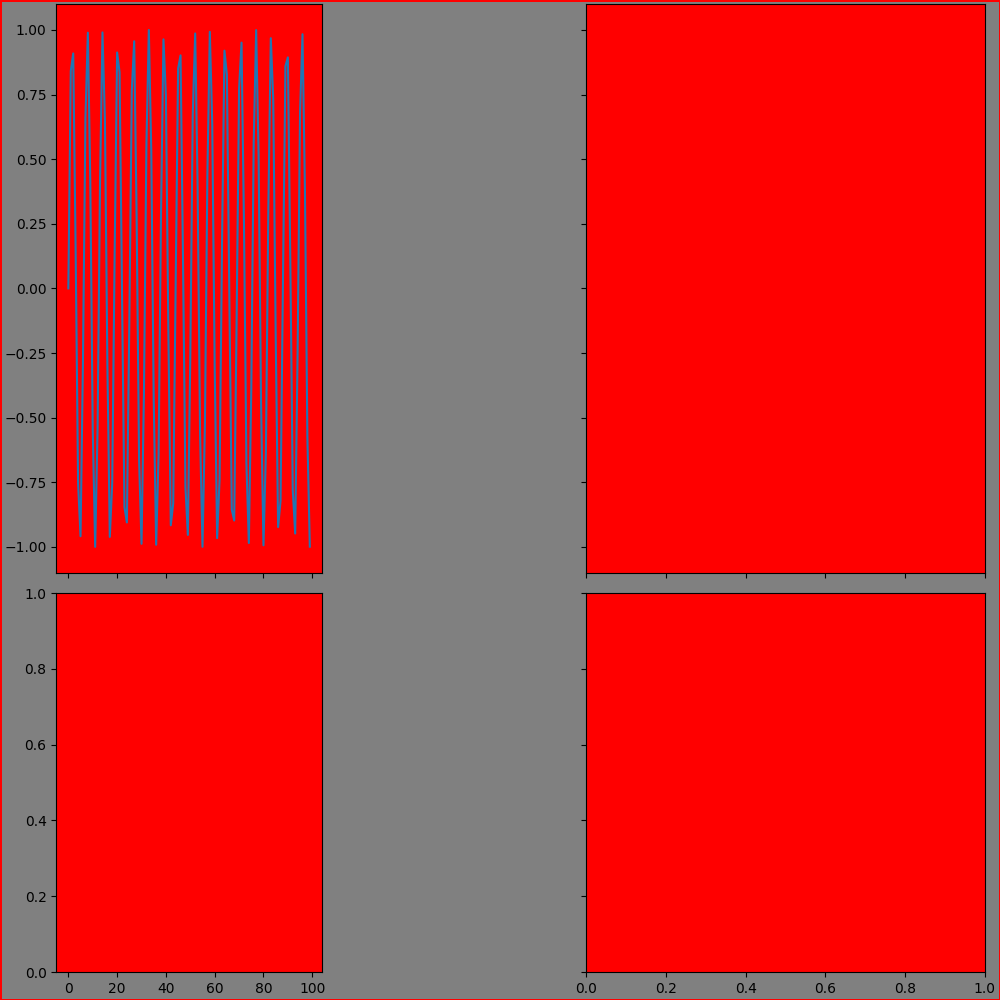
| fig, ax_array = plt.subplots(nrows=2,
ncols=2,
sharex="col", # (1)!
sharey="row", # (2)!
squeeze=True, # (3)!
width_ratios=[0.4, 0.6], # (4)!
height_ratios=[0.6, 0.4], # (5)!
subplot_kw={"facecolor": "red"}, # (6)!
gridspec_kw={"wspace": 0.5}, # (7)!
# Figure参数
figsize=(10, 10),
dpi=100.0,
frameon=True,
facecolor='gray',
edgecolor='red',
linewidth=2.0
)
ax = ax_array[0, 0]
ax.plot(x, y)
plt.show()
|
-
共享x轴, 可选:
- True/'all': 所有子图共享
- False/'none': 不共享
- 'row': 同行共享
- 'col': 同列共享
-
共享y轴, 可选:
- True/'all': 所有子图共享
- False/'none': 不共享
- 'row': 同行共享
- 'col': 同列共享
-
取消返回的子图数组的多余维度
若为False,则返回的子图数组始终为二维数组
-
每列宽度比例,相当于gridspec_kw={"width_ratios": []}
- 每行高度比例,相当于gridspec_kw={"height_ratios": []}
- Axes全局参数
- Gridspec参数
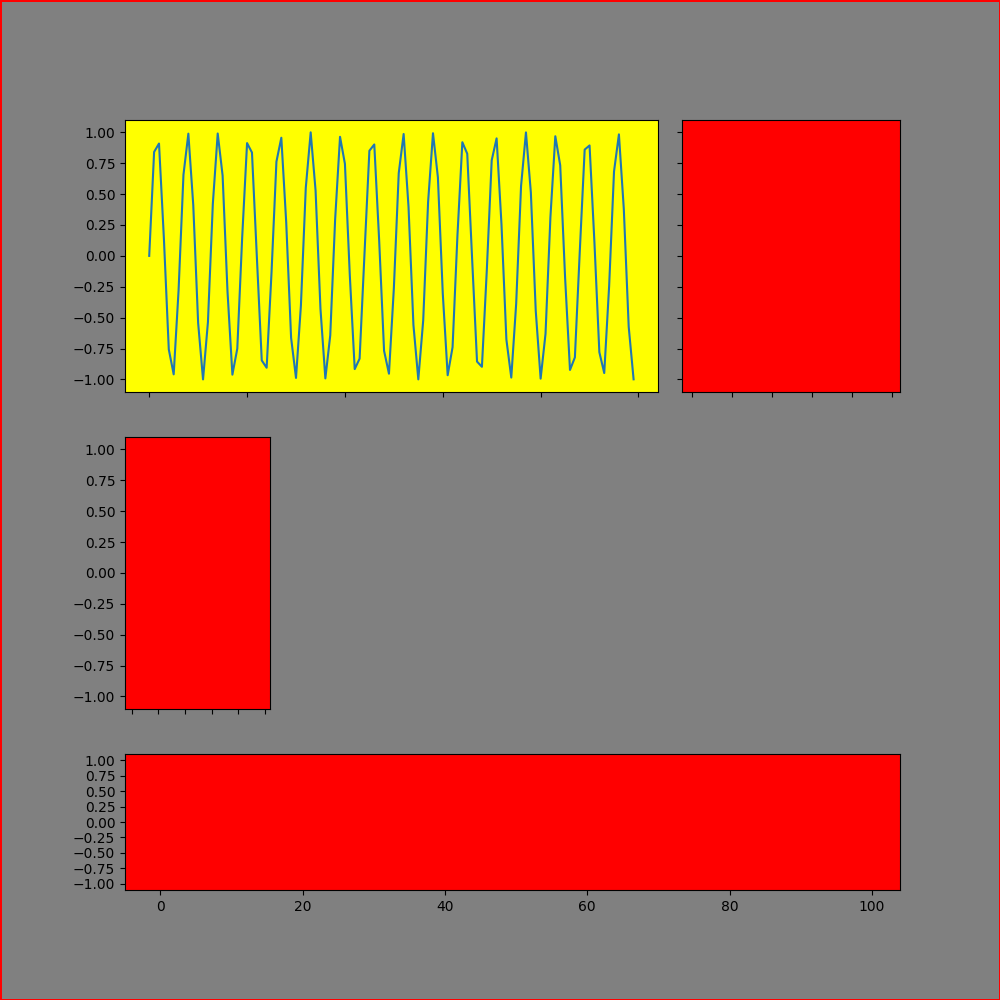
matplotlib.figure.Figure.subplot_mosaic — Matplotlib 3.10.1 documentation
根据mosaic布局子图
| fig.subplot_mosaic(mosaic) |
|---|
| mosaic = """
AAB
CDD
EEE
"""
# mosaic = "AAB;CDD;EEE"
# mosaic = [["A", "A", "B"],
# ["C", "D", "D"],
# ["E", "E", "E"]]
ax_dict = fig.subplot_mosaic(mosaic,
sharex=True, # (1)!
sharey=True, # (2)!
width_ratios=[0.2, 0.5, 0.3], # (3)!
height_ratios=[0.4, 0.4, 0.2], # (4)!
empty_sentinel="D", # (5)!
subplot_kw={"facecolor": "red"}, # (6)!
per_subplot_kw={"A": {"facecolor": "yellow"}}, # (7)!
gridspec_kw={"wspace": 0.1} # (8)!
)
ax = ax_dict['A']
ax.plot(x, y)
plt.show()
|
- 所有子图共享x轴
- 所有子图共享y轴
-
每列宽度比例
相当于gridspec_kw={"width_ratios": []}
-
每行高度比例
相当于gridspec_kw={"height_ratios": []}
-
留空标签,默认"."
- Axes全局参数
-
Axes特定参数
优先级高于subplot_kw参数
-
Gridspec参数
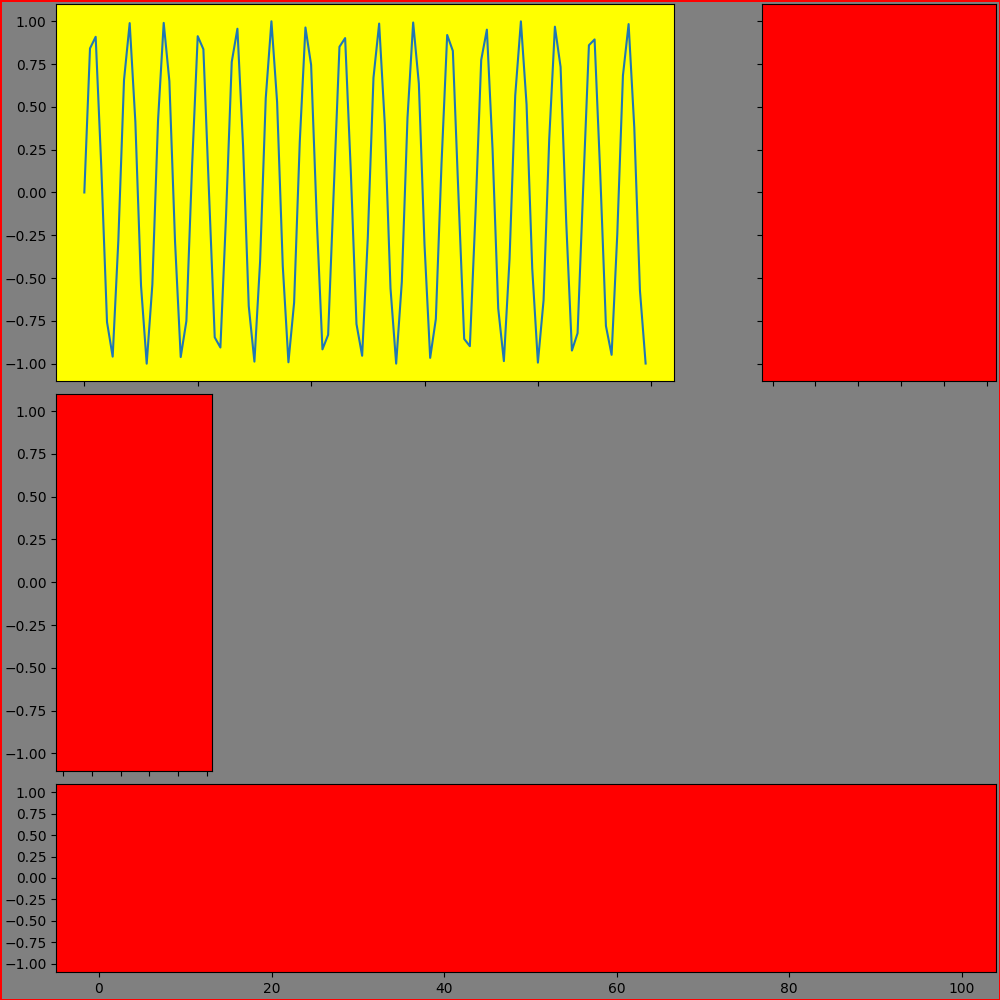
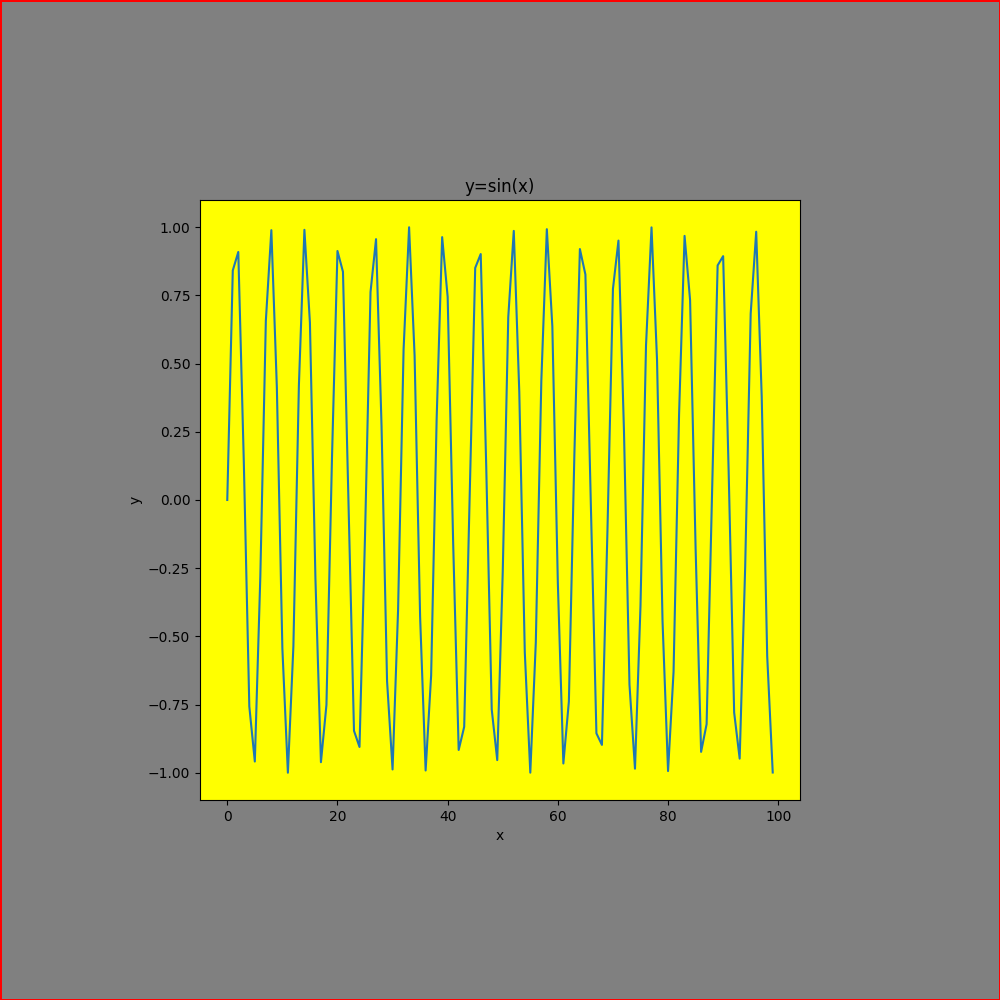
matplotlib.pyplot.subplot_mosaic — Matplotlib 3.10.1 documentation
同上,但同时返回并激活一个Figure对象(可设置参数)
| plt.subplot_mosaic(mosaic) |
|---|
| mosaic = """
AAB
CDD
EEE
"""
# mosaic = "AAB;CDD;EEE"
# mosaic = [["A", "A", "B"],
# ["C", "D", "D"],
# ["E", "E", "E"]]
fig, ax_dict = plt.subplot_mosaic(mosaic,
sharex=True, # (1)!
sharey=True, # (2)!
width_ratios=[0.2, 0.5, 0.3], # (3)!
height_ratios=[0.4, 0.4, 0.2], # (4)!
empty_sentinel="D", # (5)!
subplot_kw={"facecolor": "red"}, # (6)!
per_subplot_kw={"A": {"facecolor": "yellow"}}, # (7)!
gridspec_kw={"wspace": 0.1}, # (8)!
# Figure参数
figsize=(10, 10),
dpi=100.0,
frameon=True,
facecolor='gray',
edgecolor='red',
linewidth=2.0
)
ax = ax_dict['A']
ax.plot(x, y)
plt.show()
|
- 所有子图共享x轴
- 所有子图共享y轴
-
每列宽度比例
相当于gridspec_kw={"width_ratios": []}
-
每行高度比例
相当于gridspec_kw={"height_ratios": []}
-
留空标签,默认"."
- Axes全局参数
-
Axes特定参数
优先级高于subplot_kw参数
-
Gridspec参数
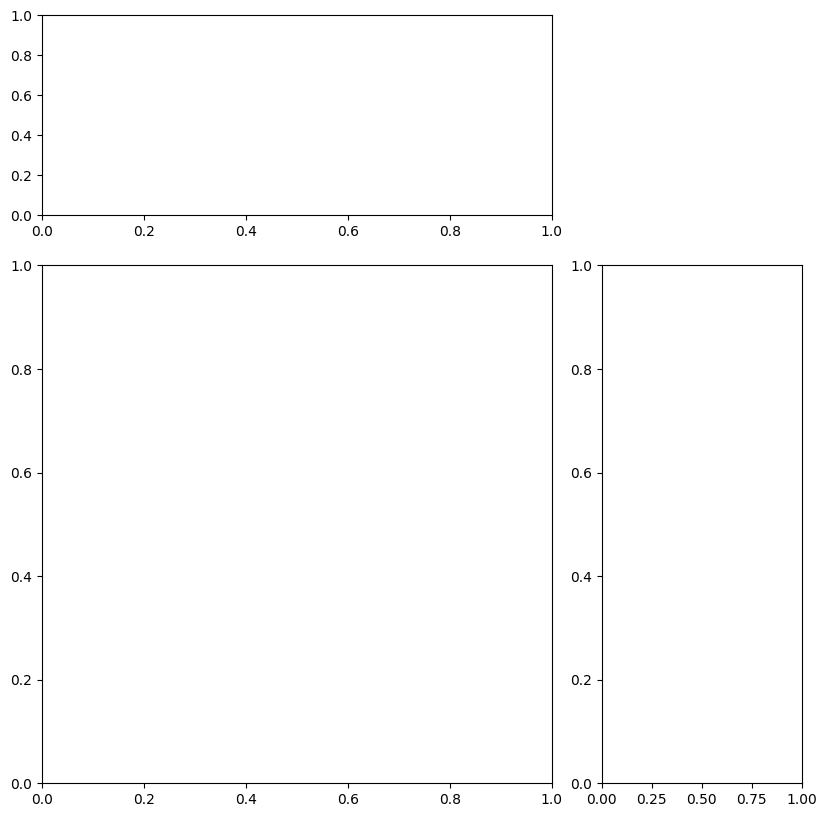
副子图添加
mpl_toolkits.axes_grid1.axes_divider.AxesDivider — Matplotlib 3.10.3 documentation
在原始Axes的给定侧("top"、"right"、"bottom" 或 "left")上创建一个新的 Axes,其高度或宽度与原始Axes相同。
-
position:新Axes相对于主Axes的位置。可选"left", "right", "bottom", "top"。
-
size:新Axes的宽度或高度。
-
pad:Axes之间的填充。默认为主Axes宽度(对于左或右Axes)的rcParams["figure.subplot.wspace"](默认:0.2)倍或主Axes高度(对于底或顶Axes)的rcParams["figure.subplot.hspace"](默认:0.2)倍。
**kwargs所有额外的关键字参数都会传递给创建的Axes。
| axes_divider |
|---|
| from mpl_toolkits.axes_grid1.axes_divider import make_axes_locatable
fig = plt.figure(figsize=(8, 8), dpi=100, layout="constrained")
ax = fig.add_subplot(1, 1, 1)
ax_divider = make_axes_locatable(ax)
ax1 = ax_divider.append_axes(position="right", size=2, pad=0.5)
ax2 = ax_divider.append_axes(position="top", size=2, pad=0.5)
plt.show()
|
matplotlib.axes.Axes.inset_axes — Matplotlib 3.10.3 documentation
在原始Axes上创建一个新的 Axes。
-
bounds:[x0, y0, width, height],新子图的左下角坐标及宽高。
-
transform:相对坐标系统。默认ax.transAxes。
**kwargs所有额外的关键字参数都会传递给创建的Axes。
| inset_axes |
|---|
| fig = plt.figure(figsize=(8, 8), dpi=100, layout="constrained")
ax = fig.add_subplot(1, 1, 1)
ax1 = ax.inset_axes(bounds=(1.1, 0, 0.3, 1), transform=ax.transAxes)
ax2 = ax.inset_axes(bounds=(0, 1.1, 1, 0.3), transform=ax.transAxes)
plt.show()
|
Axes布局调整
matplotlib.figure.Figure.subplots_adjust — Matplotlib 3.10.1 documentation
matplotlib.pyplot.subplots_adjust — Matplotlib 3.10.1 documentation
| Axes布局调整 |
|---|
| fig.subplots_adjust(left=None,
bottom=None,
right=None,
top=None,
wspace=None,
hspace=None)
|
matplotlib.figure.Figure.subfigures — Matplotlib 3.10.1 documentation
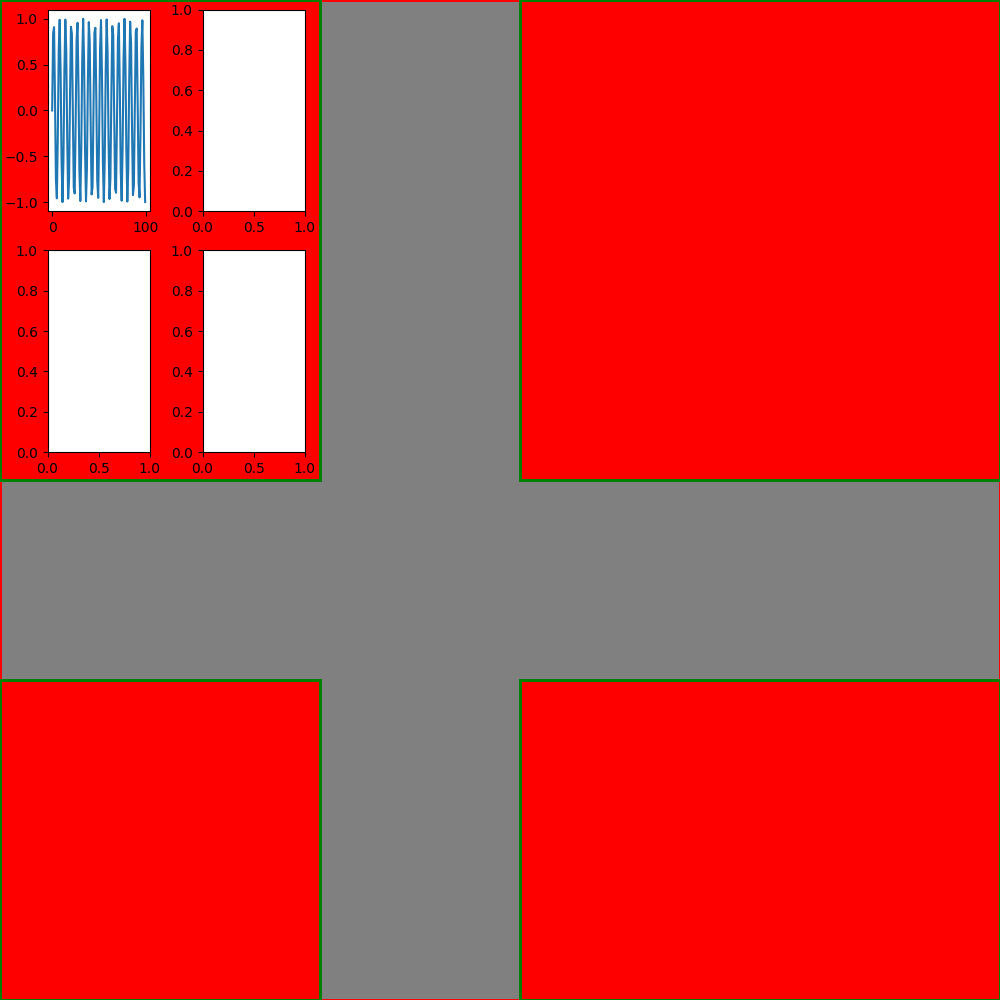
子图组的添加
| subfigure的设置 |
|---|
| subfigs = fig.subfigures(nrows=2,
ncols=2,
squeeze=True, # (1)!
wspace=0.4, # (2)!
hspace=0.4, # (3)!
width_ratios=[0.4, 0.6], # (4)!
height_ratios=[0.6, 0.4], # (5)!
# Figure参数
facecolor='red',
edgecolor='green',
linewidth=2.0
)
subfig0 = subfigs[0][0]
axes_array = subfig0.subplots(2, 2)
ax = axes_array[0][0]
ax.plot(x, y)
plt.show()
|
-
取消返回的子图组数组的多余维度
若为False,则返回的子图组数组始终为二维数组
-
列间隔(平均轴宽度百分比)
- 行间隔(平均轴宽度百分比)
- 每列宽度比例
- 每行高度比例