填充(Fill)
导入模块与数据准备 import matplotlib as mpl
import matplotlib.pyplot as plt
import seaborn as sns
import numpy as np
x = np . arange ( 1 , 11 , 1 )
"""
[ 1 2 3 4 5 6 7 8 9 10]
"""
y1 = np . sin ( x ) + 5
"""
[5.84147098 5.90929743 5.14112001 4.2431975 4.04107573 4.7205845 5.6569866 5.98935825 5.41211849 4.45597889]
"""
y2 = x + 2
"""
[ 3 4 5 6 7 8 9 10 11 12]
"""
y1 <= y2
"""
[False False False True True True True True True True]
"""
fill_between
matplotlib.axes.Axes.fill_between — Matplotlib 3.10.1 documentation
fill_between(x, y1, y2=0, where=None, interpolate=False, step=None, *, data=None, **kwargs)
填充两个水平曲线之间的区域。曲线由点(x, y1)和(x, y2)定义。这会创建一个或多个多边形来描述填充区域。可以使用 where参数排除一些水平部分不进行填充。默认情况下,边缘将直接连接给定的点。
x :曲线节点的 x 坐标。
y1 :第一条曲线节点的 y 坐标。
y2 :第二条曲线节点的 y 坐标。默认为0。
where :定义要排除填充的一些水平区域的条件。填充区域由坐标x[where]定义。更确切地说,如果where[i] and where[i+1],则填充x[i]和x[i+1]之间。请注意,此定义意味着在where中两个 False 值之间的孤立 True 值不会导致填充。由于相邻的 False 值,True 位置的两边保持未填充。
interpolate :此选项仅在where参数被使用且两条曲线相交时相关。从语义上讲,where参数通常用于 y1 > y2 或类似的情况。默认情况下,定义填充区域的多边形的节点将仅放置在 x 数组中的位置。这样的多边形无法在交点附近很好地描述上述语义。包含交点的 x 部分将简单地被裁剪。将interpolate 参数设置为 True 将计算实际的交点,并将填充区域扩展到这一点。
step :如果填充应该是阶梯函数,则定义step,即在 x 之间保持恒定。该值确定阶梯将发生的位置。
data :如果提供,以下参数也接受一个字符串s ,如果s是data中的键,则解释为data[s]:x , y1 , y2 , where
不包括交点 包括交点 step样式
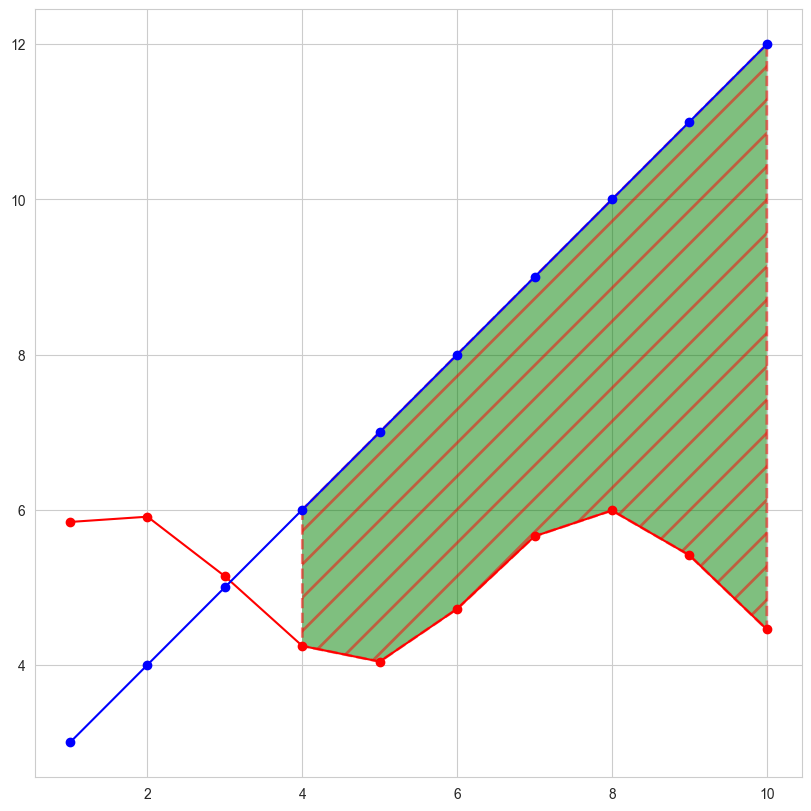
不包括交点 fig = plt . figure ( figsize = ( 8 , 8 ), dpi = 100 , layout = "constrained" )
ax = fig . add_subplot ( 1 , 1 , 1 )
ax . plot ( x , y1 , c = 'r' , marker = 'o' )
ax . plot ( x , y2 , c = 'b' , marker = 'o' )
ax . fill_between ( x , y1 , y2 ,
where = y1 <= y2 ,
facecolor = 'g' ,
linestyle = '--' ,
linewidth = 2 ,
hatch = '/' ,
hatch_linewidth = 2 ,
edgecolor = 'r' ,
alpha = 0.5
)
plt . show ()
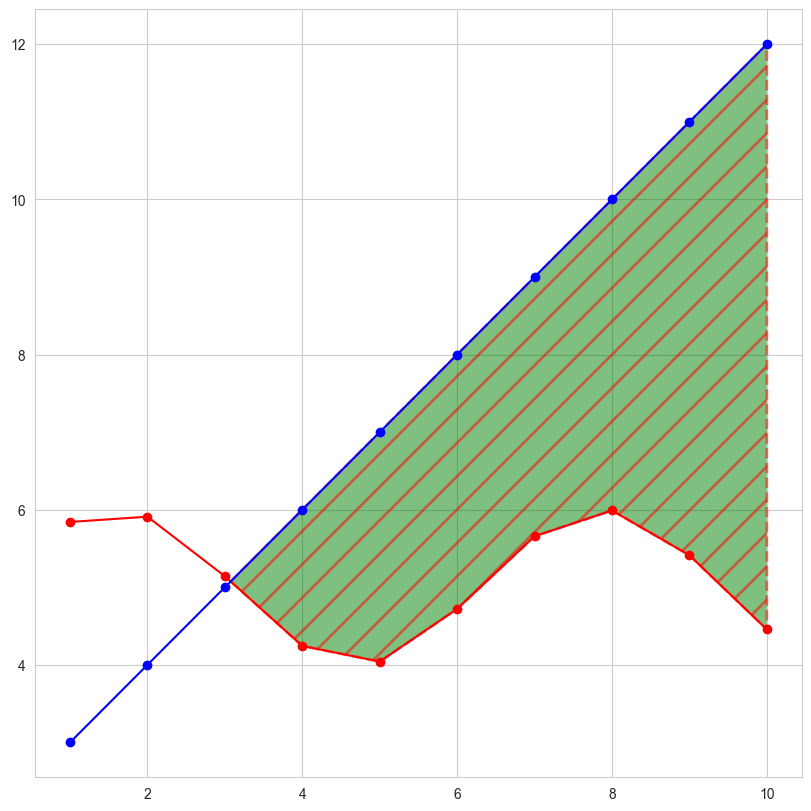
包括交点 fig = plt . figure ( figsize = ( 8 , 8 ), dpi = 100 , layout = "constrained" )
ax = fig . add_subplot ( 1 , 1 , 1 )
ax . plot ( x , y1 , c = 'r' , marker = 'o' )
ax . plot ( x , y2 , c = 'b' , marker = 'o' )
ax . fill_between ( x , y1 , y2 ,
where = y1 <= y2 ,
interpolate = True ,
facecolor = 'g' ,
linestyle = '--' ,
linewidth = 2 ,
hatch = '/' ,
hatch_linewidth = 2 ,
edgecolor = 'r' ,
alpha = 0.5
)
plt . show ()
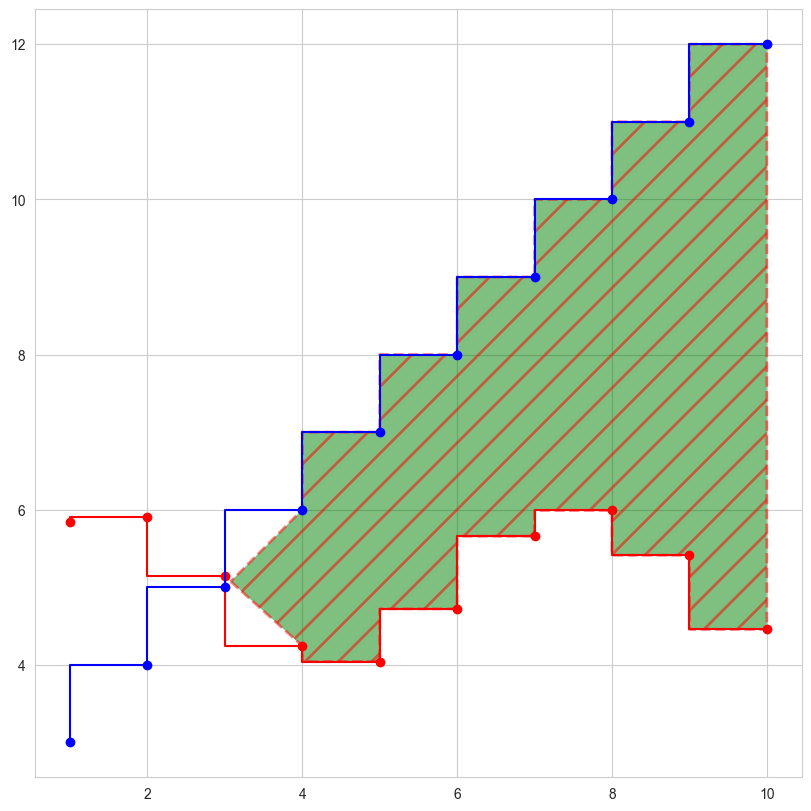
step样式 fig = plt . figure ( figsize = ( 8 , 8 ), dpi = 100 , layout = "constrained" )
ax = fig . add_subplot ( 1 , 1 , 1 )
ax . plot ( x , y1 , c = 'r' , marker = 'o' , ds = 'steps-pre' )
ax . plot ( x , y2 , c = 'b' , marker = 'o' , ds = 'steps-pre' )
ax . fill_between ( x , y1 , y2 ,
where = y1 <= y2 ,
interpolate = True ,
step = 'pre' ,
facecolor = 'g' ,
linestyle = '--' ,
linewidth = 2 ,
hatch = '/' ,
hatch_linewidth = 2 ,
edgecolor = 'r' ,
alpha = 0.5
)
plt . show ()
fill_betweenx
matplotlib.axes.Axes.fill_betweenx — Matplotlib 3.10.1 documentation
fill_betweenx(y, x1, x2=0, where=None, step=None, interpolate=False, *, data=None, **kwargs)
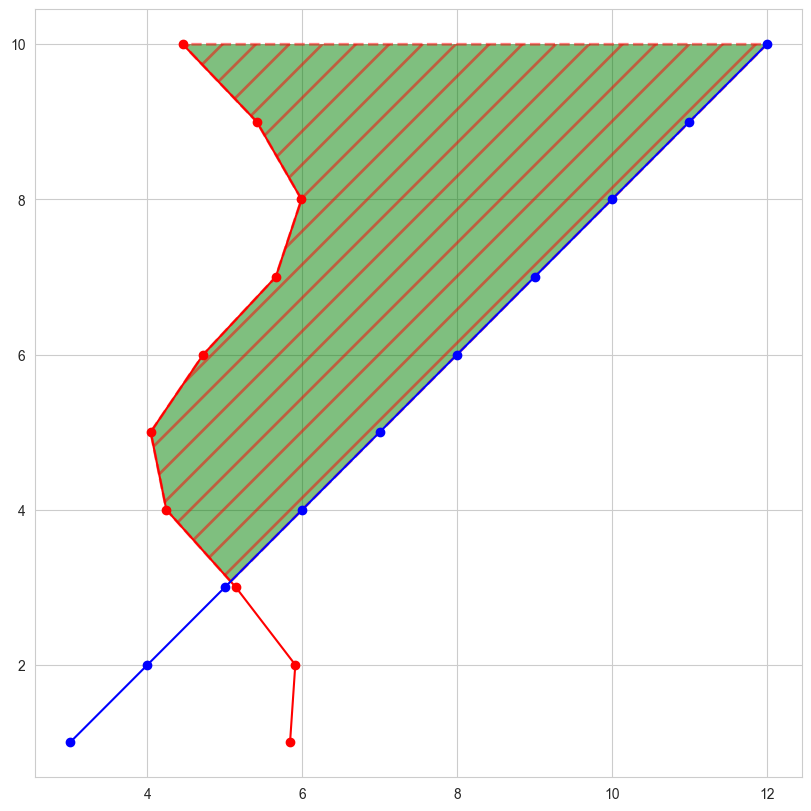
填充两条垂直曲线之间的区域。曲线由点 (y, x1)和 (y, x2)定义。这会创建一个或多个多边形来描述填充区域。其余同上。
fill_betweenx fig = plt . figure ( figsize = ( 8 , 8 ), dpi = 100 , layout = "constrained" )
ax = fig . add_subplot ( 1 , 1 , 1 )
ax . plot ( y1 , x , c = 'r' , marker = 'o' )
ax . plot ( y2 , x , c = 'b' , marker = 'o' )
ax . fill_betweenx ( x , y1 , y2 ,
where = y1 <= y2 ,
interpolate = True ,
facecolor = 'g' ,
linestyle = '--' ,
linewidth = 2 ,
hatch = '/' ,
hatch_linewidth = 2 ,
edgecolor = 'r' ,
alpha = 0.5
)
plt . show ()
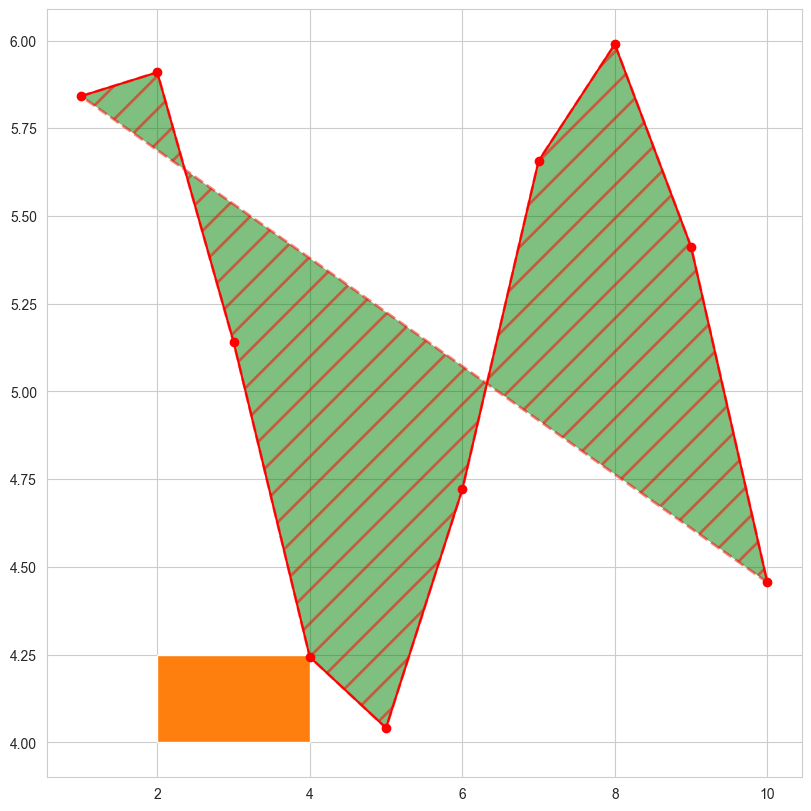
fill
matplotlib.axes.Axes.fill — Matplotlib 3.10.1 documentation
fill(*args, data=None, **kwargs)
绘制填充多边形。每个多边形由其节点的 x 和 y 位置列表定义,可选地后跟颜色指定符。对于没有颜色指定符的多边形,使用标准颜色循环。可以通过提供多个 x, y, [颜色]组来绘制多个多边形。**kwargs其它参数传递给Polygon类。
fill ax . fill ( x , y ) # a polygon with default color
ax . fill ( x , y , "b" ) # a blue polygon
ax . fill ( x , y , x2 , y2 ) # two polygons
ax . fill ( x , y , "b" , x2 , y2 , "r" ) # a blue and a red polygon
fill fig = plt . figure ( figsize = ( 8 , 8 ), dpi = 100 , layout = "constrained" )
ax = fig . add_subplot ( 1 , 1 , 1 )
ax . plot ( x , y1 , c = 'r' , marker = 'o' )
ax . fill ( x , y1 , closed = True , # (1)!
facecolor = "g" ,
linestyle = "--" ,
linewidth = 2 ,
hatch = "/" ,
hatch_linewidth = 2 ,
edgecolor = "r" ,
alpha = 0.5
)
ax . fill ([ 2 , 4 , 4 , 2 ], [ 4 , 4 , 4.25 , 4.25 ])
plt . show ()
是否绘制封闭线