图例(Legend)
Legend guide — Matplotlib 3.10.1 documentation
matplotlib.legend — Matplotlib 3.10.1 documentation
matplotlib.axes.Axes.legend — Matplotlib 3.10.1 documentation
matplotlib.pyplot.legend — Matplotlib 3.10.1 documentation
matplotlib.figure.Figure.legend — Matplotlib 3.10.1 documentation
图例添加
Note
label 为 空字符串('')、'_'(默认) 或以 '_'开头 的handle将被忽略
自带标签
- 指定图形绘制图例,默认所有图形

- 指定图形绘制图例,默认所有图形

设置标签
| Axes | |
|---|---|
- 指定图形绘制图例,默认所有图形
- 为指定的图形设置标签,用于图例绘制,覆盖自带label
| Figure | |
|---|---|
- 指定图形绘制图例,默认所有图形
- 为指定的图形设置标签,用于图例绘制,覆盖自带label
图例位置
-
loc:默认
rcParams["legend.loc"]='best'-
位置字符串或位置代码:图例在Axes、Figure或bounding box中的位置;图例的某个点位置
字符串 代码 含义 应用 'best' (默认) 0 以下9种中与图形重叠最少的位置 Axes 'upper right' 1 右上角 Axes / Figure 'upper left' 2 左上角 Axes / Figure 'lower left' 3 左下角 Axes / Figure 'lower right' 4 右下角 Axes / Figure 'center left' 6 左侧正中 Axes / Figure 'right' / 'center right' 5 / 7 右侧正中 Axes / Figure 'lower center' 8 下方正中 Axes / Figure 'upper center' 9 上方正中 Axes / Figure 'center' 10 正中 Axes / Figure 'outside upper left' / Axes外的上方左侧 Figure(layout='constraind') 'outside left upper' / Axes外的左侧上方 Figure(layout='constraind') 'outside upper right' / Axes外的上方右侧 Figure(layout='constraind') 'outside right upper' / Axes外的右侧上方 Figure(layout='constraind') 'outside lower left' / Axes外的下方左侧 Figure(layout='constraind') 'outside left lower' / Axes外的左侧下方 Figure(layout='constraind') 'outside lower right' / Axes外的下方右侧 Figure(layout='constraind') 'outside right lower' / Axes外的右侧下方 Figure(layout='constraind') 'outside upper center' / Axes外的上方正中 Figure(layout='constraind') 'outside lower center' / Axes外的下方正中 Figure(layout='constraind') -
(x, y):图例左下角在Axes或Figure中的坐标(此时忽略 bbox_to_anchor参数)
-
-
bbox_to_anchor:
-
(x, y):图例某个点(由loc参数指定)在Axes或Figure中的坐标
-
(x, y, width, height):在Axes或Figure中从(x, y)坐标创建一个宽width, 高height的bounding box用于放置图例
-
-
bbox_transform:
bbox_to_anchor参数参考的坐标系。默认情况下,与调用情况有关,
Axes.legend()则参考Axes坐标系(Axes.transAxes),Figure.legend()则采用Figure坐标系(Figure.transFigure)。Note
Axes或Figure坐标系 指从(0, 0)到(1, 1),即 左下角为(0, 0),右上角为(1, 1)
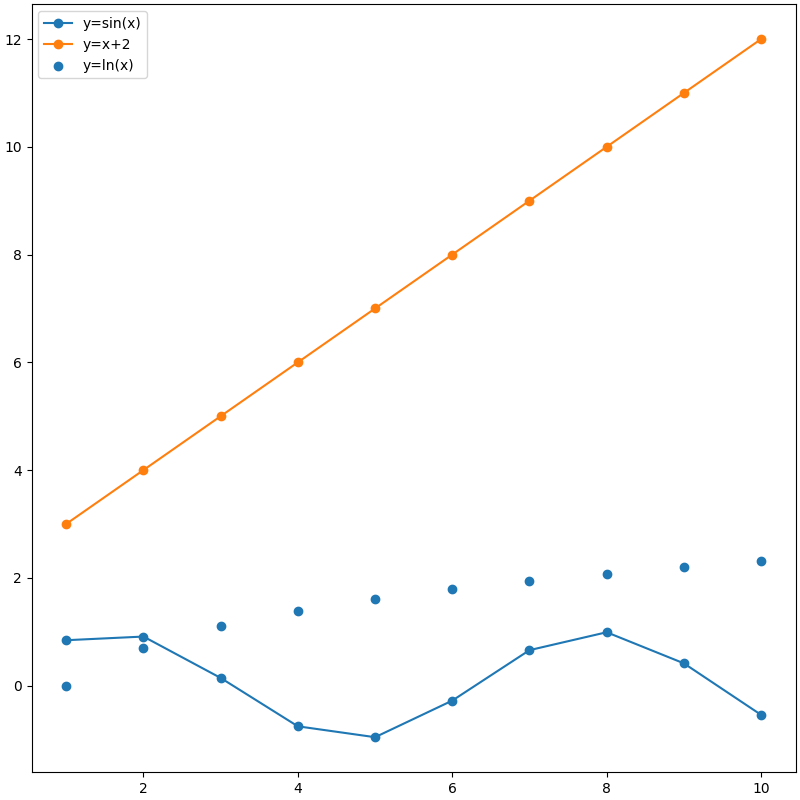
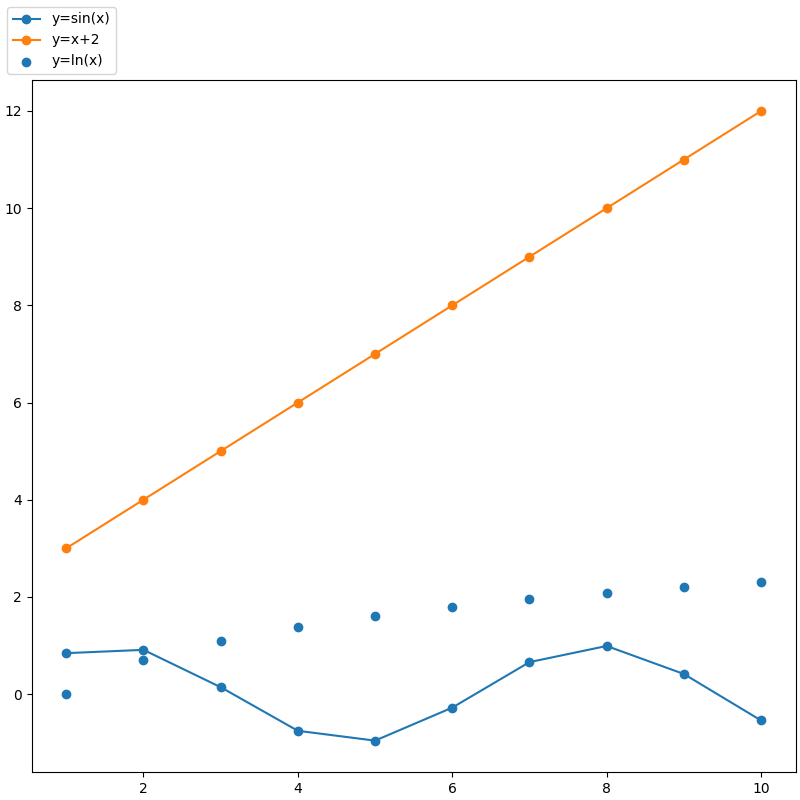
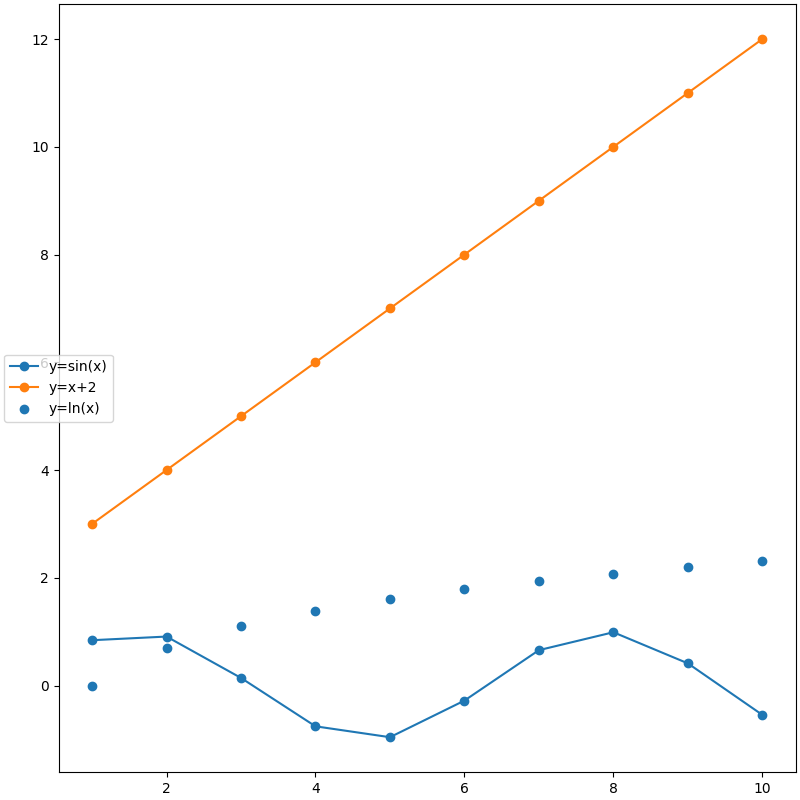
loc='':图例位置
| Axes下方正中 | |
|---|---|
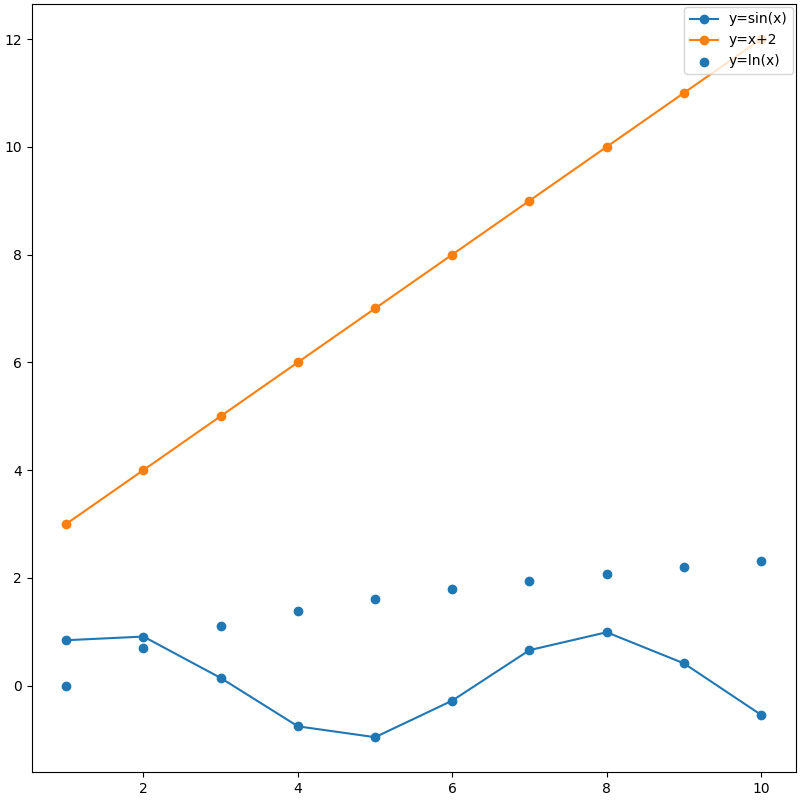
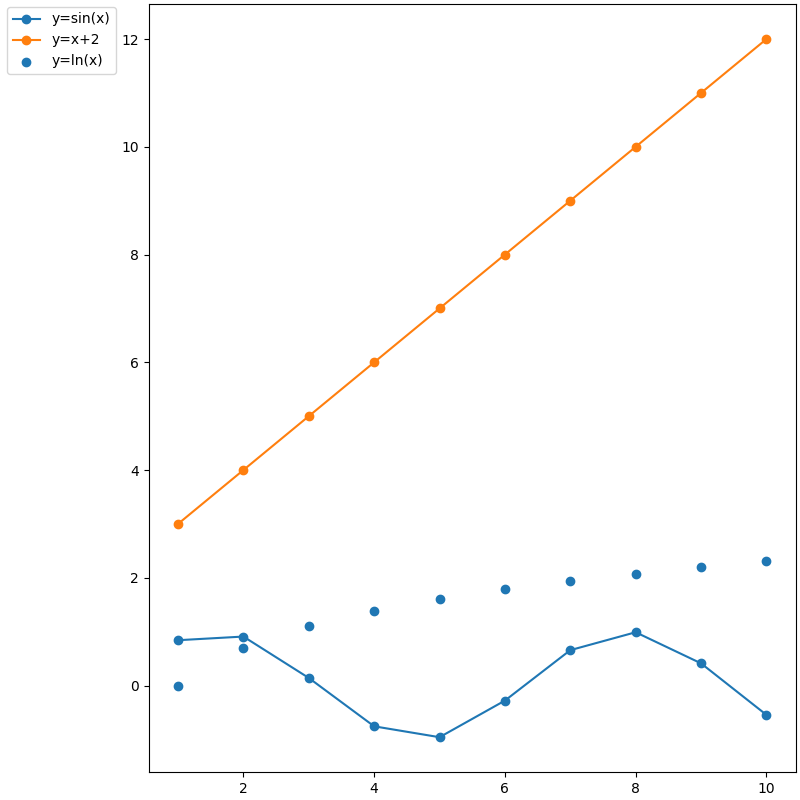
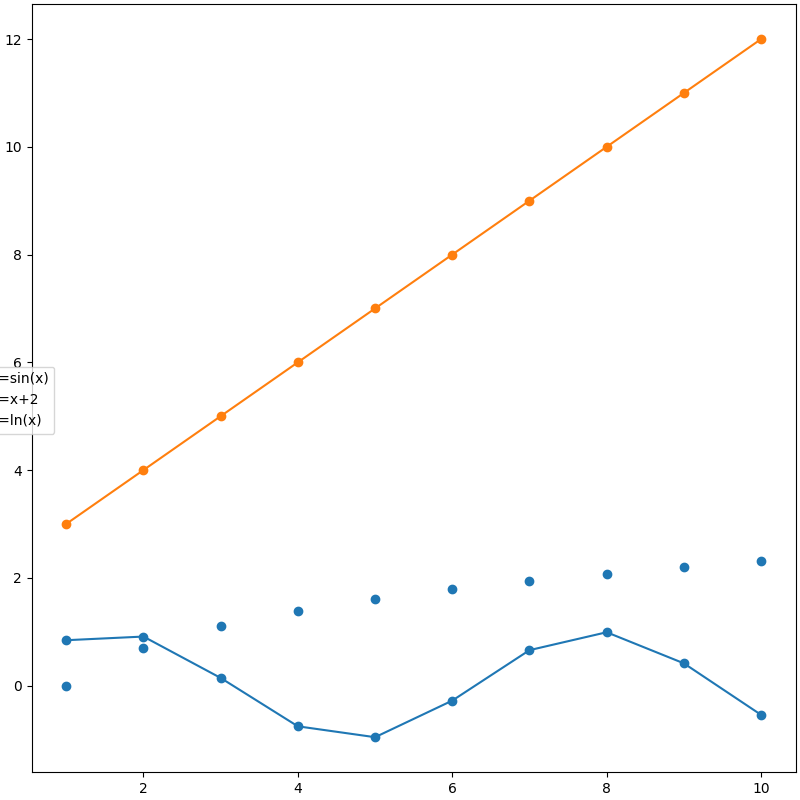
| Figure下方正中 | |
|---|---|
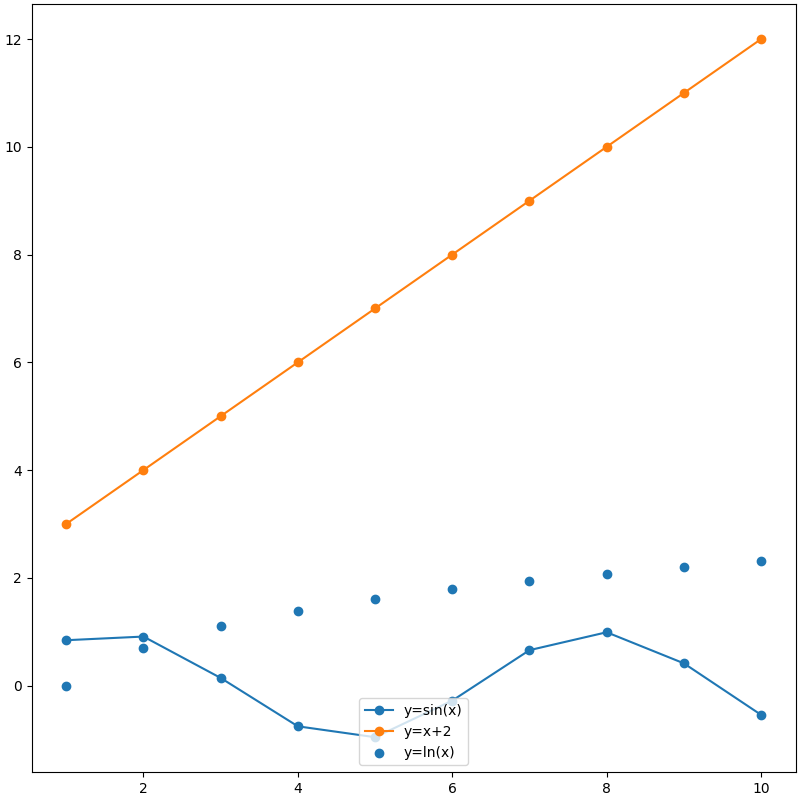
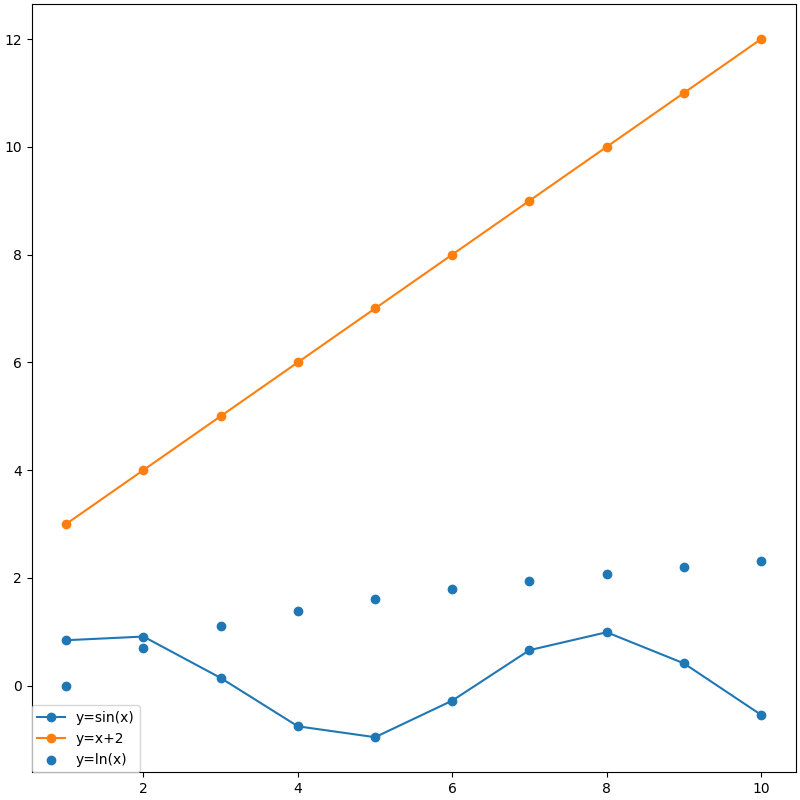
| Axes外上方左侧 | |
|---|---|
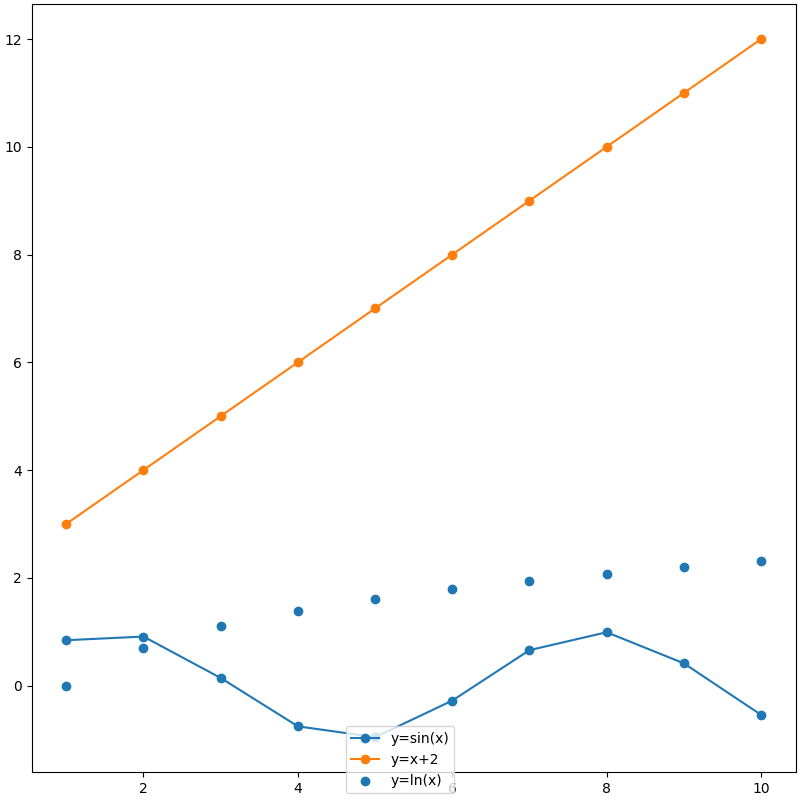
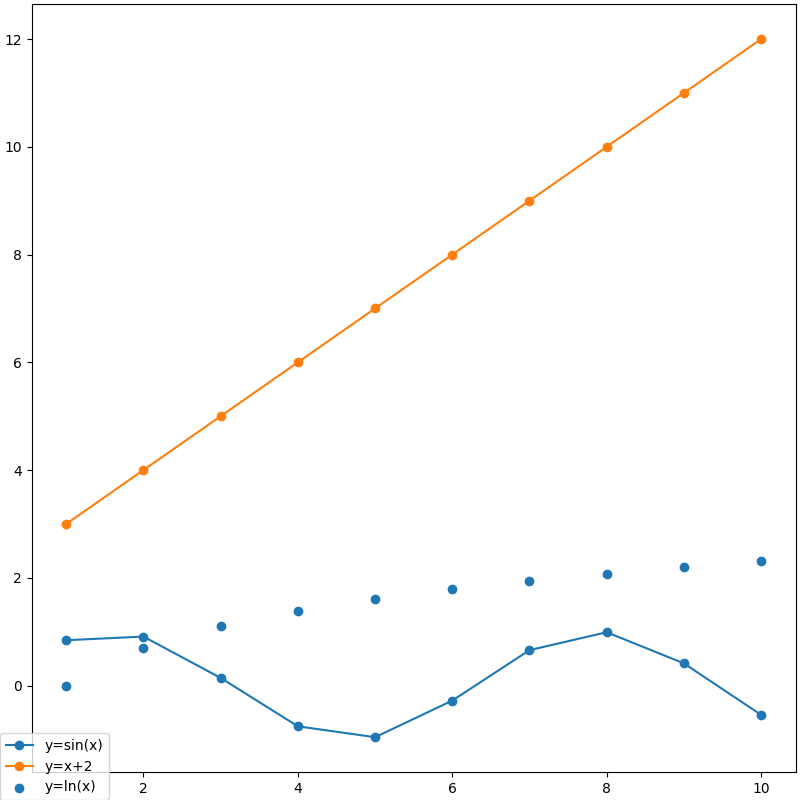
| Axes外左侧上方 | |
|---|---|
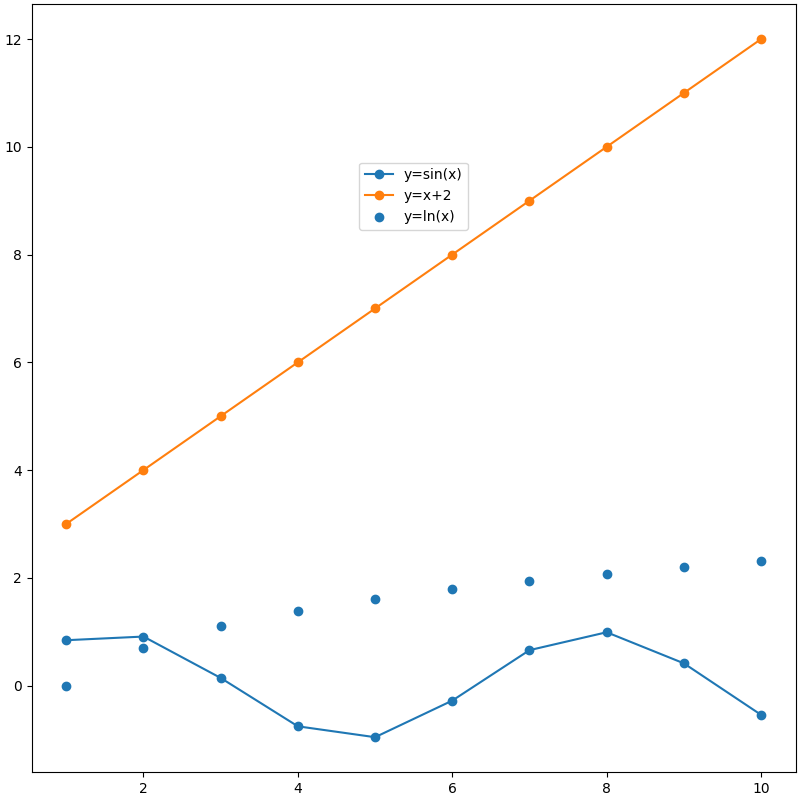
loc=(x, y):图例左下角坐标
| Axes | |
|---|---|
- 图例左下角在Axes中的坐标为(0, 0)
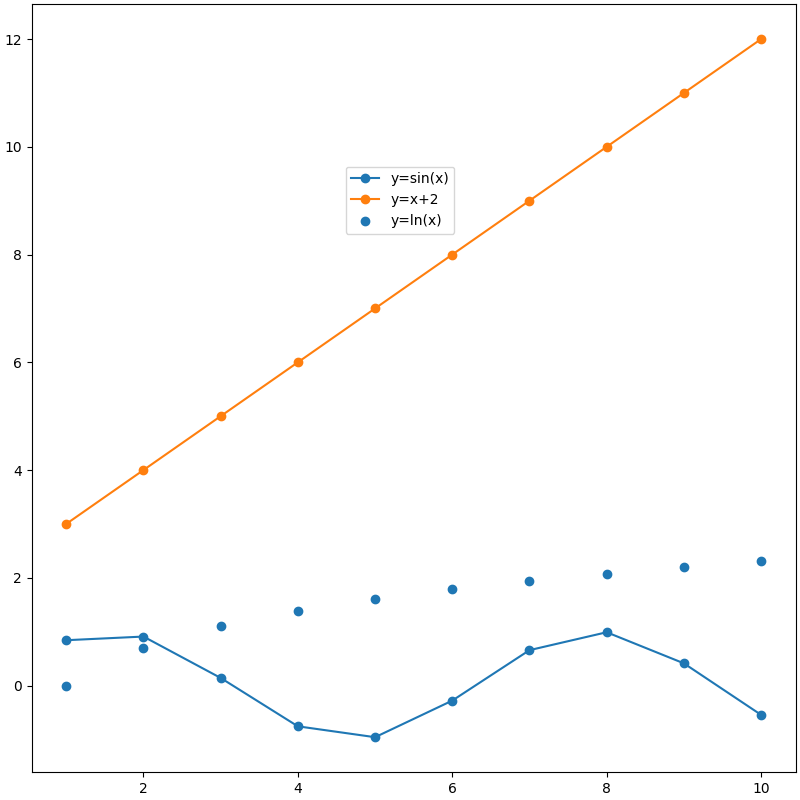
| Figure | |
|---|---|
- 图例左下角在Figure中的坐标为(0, 0)
loc='', bbox_to_anchor=(x, y):图例定点坐标
loc='', bbox_to_anchor=(x, y, width, height):图例在bounding box中位置
其它参数
Understand layout in matplotlib legend - legendkit 0.3.5 documentation
- 按优先级降序排列的字体系列列表rcParams["font.family"], 可选(设备支持的字体):
- 'sans-serif'(默认)
- 'serif'
- 'cursive'
- 'fantasy'
- 'monospace'等
- 字体样式rcParams["font.style"], 可选:
- 'normal'(默认,罗马体)
- 'italic'(斜体)
- 'oblique'(倾斜)
- 字体变体rcParams["font.variant"], 可选:
- 'normal'(默认)
- 'small-caps'
- 字体伸展与压缩rcParams["font.stretch"], 可选:
- 0~1000
- 'ultra-condensed'
- 'extra-condensed'
- 'condensed'
- 'semi-condensed'
- 'normal'(默认)
- 'semi-expanded'
- 'expanded'
- 'extra-expanded'
- 'ultra-expanded'
- 字体粗细rcParams["font.weight"], 可选:
- 0~1000
- 'ultralight'
- 'light'
- 'normal'(默认)
- 'regular'
- 'book'
- 'medium'
- 'roman'
- 'semibold'
- 'demibold'
- 'demi'
- 'bold'
- 'heavy'
- 'extra bold'
- 'black'
-
字体大小rcParams["font.size"], 可选:
绝对大小(浮点数,默认10.0) 或 相对大小
- 'xx-small'
- 'x-small'
- 'small'
- 'medium'
- 'large'
- 'x-large'
- 'xx-large'
-
用于呈现数学文本的字体rcParams["mathtext.fontset"], 可选:
- 'dejavusans'(默认)
- 'dejavuserif'
- 'cm'
- 'stix'
- 'stixsans'
- 'custom'
- 字体文件路径
- 字体大小: 仅当prop未指定时被使用
-
字体颜色rcParams["legend.labelcolor"],默认None(rcParams["text.color"]="black"), 可选:
颜色字符串、颜色字符串列表或者与线条/标记点颜色一致
- 'linecolor'
- 'markerfacecolor'/'mfc'
- 'markeredgecolor'/'mec'
-
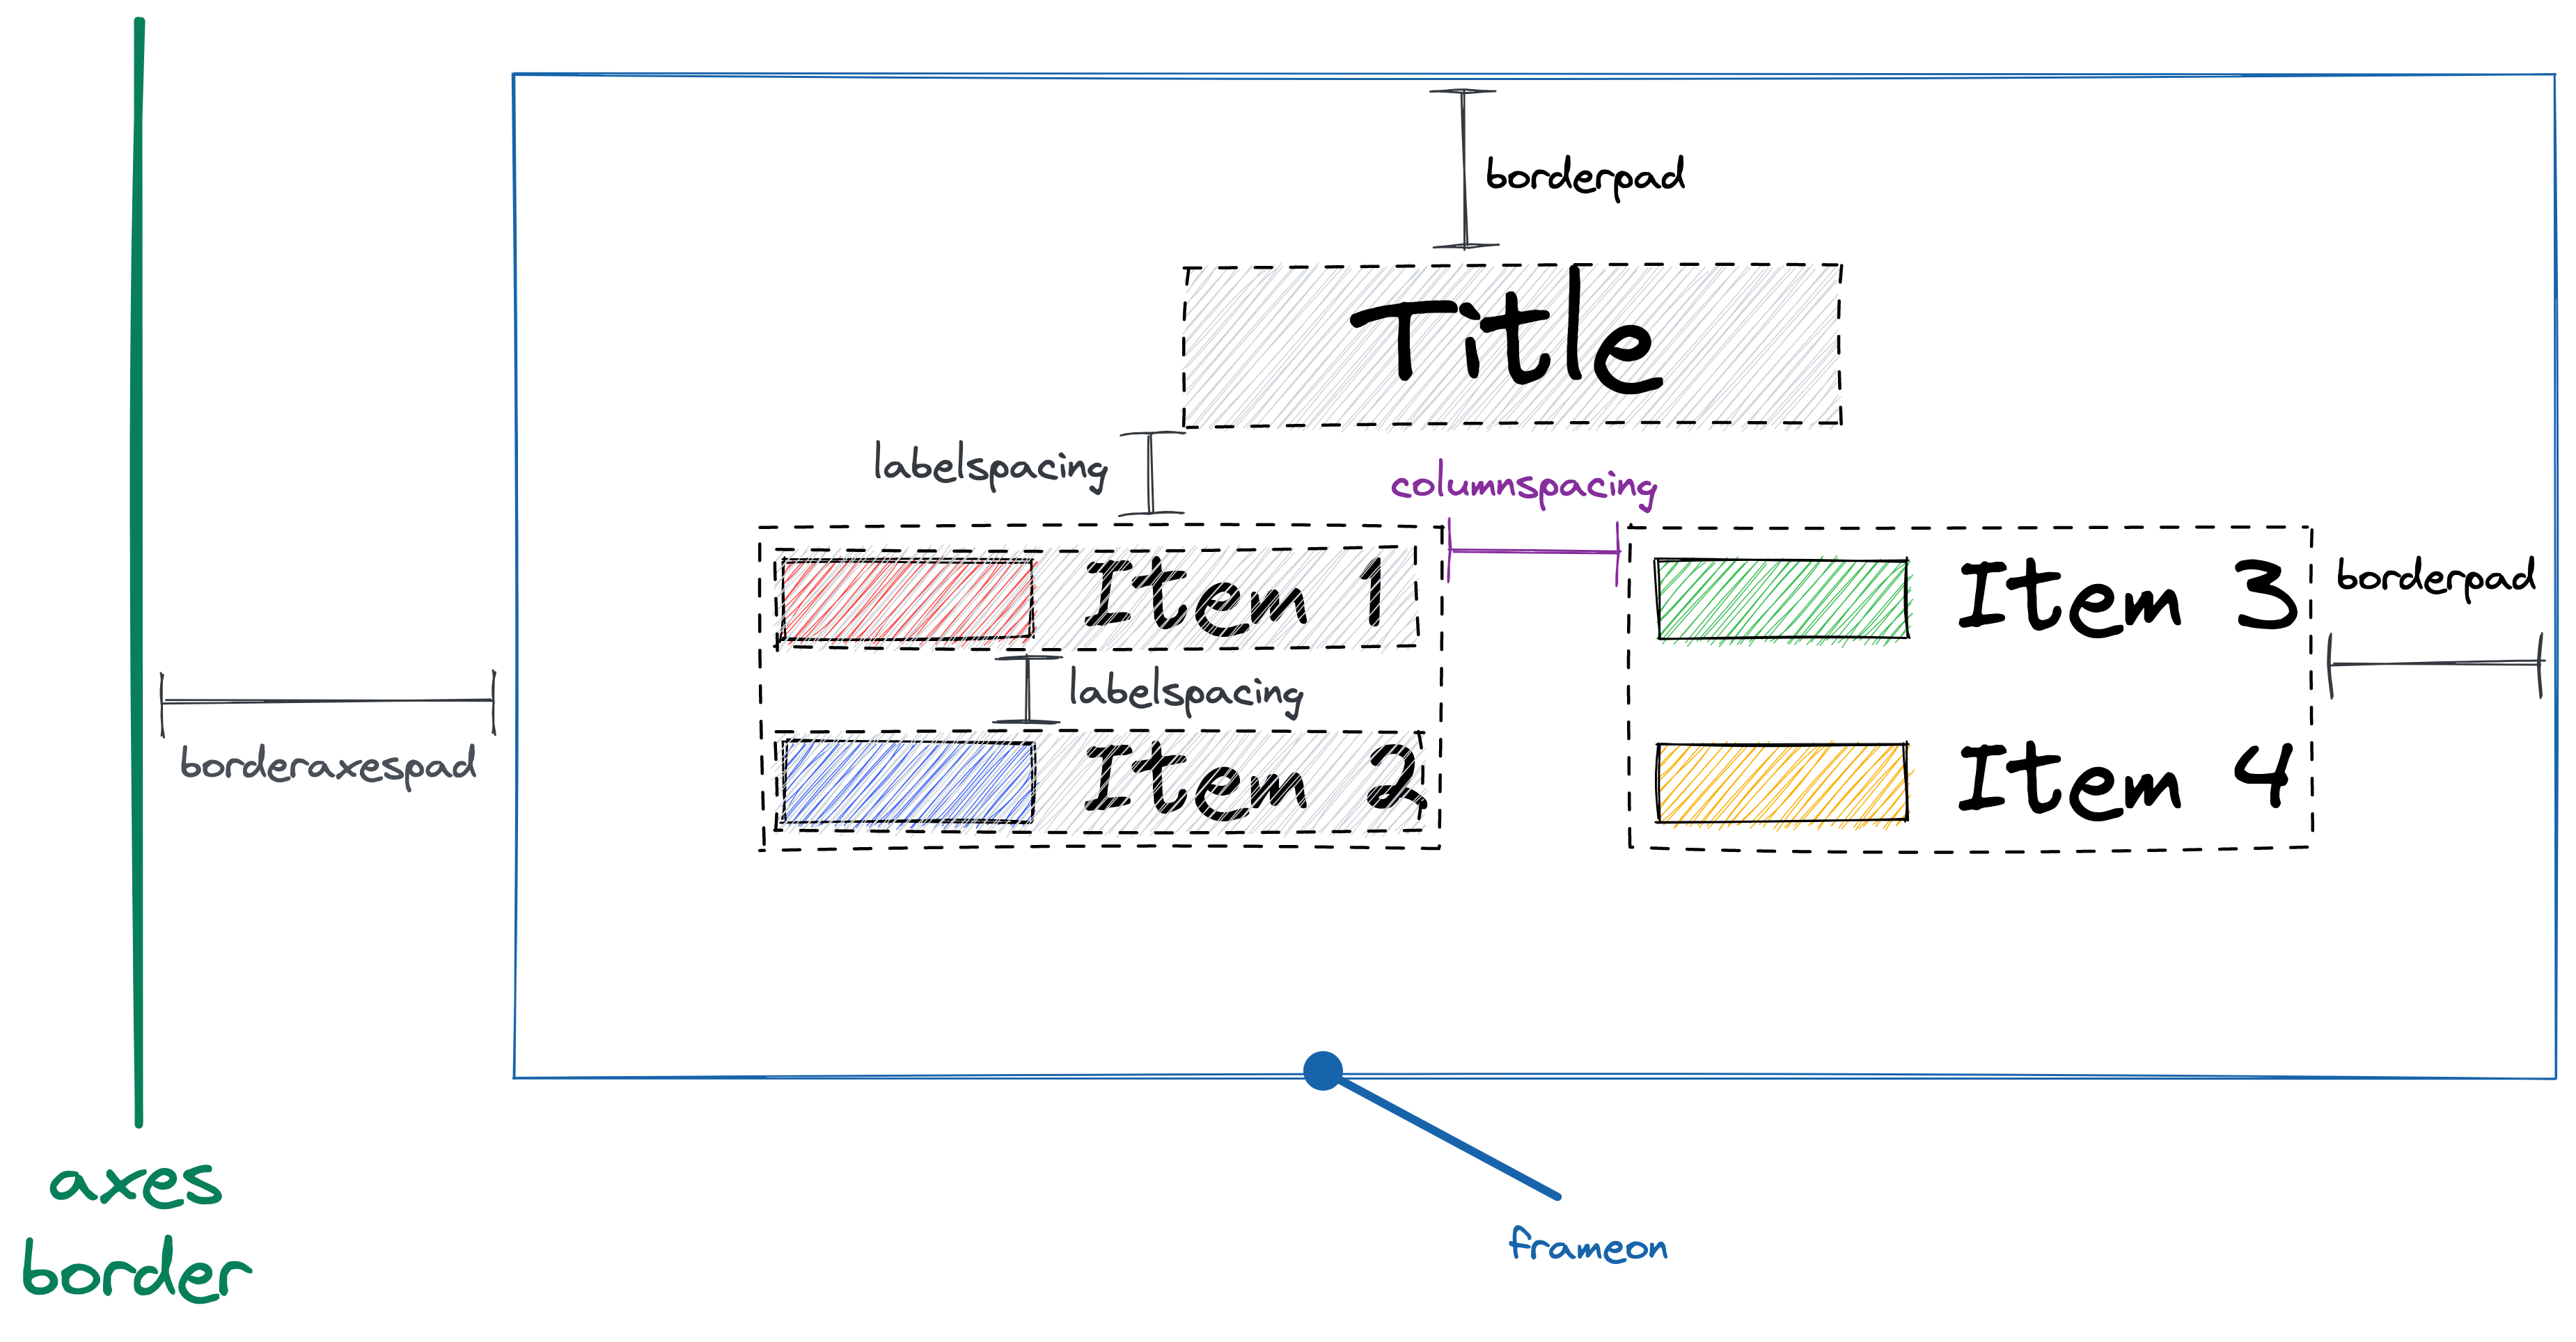
标题,默认None
- 默认rcParams["legend.title_fontsize"]=None, 不能与title_fontproperties同时指定
- 图例标题及图例项目的对齐方式, 可选:
- 'center'(默认)
- 'left'
- 'right'
- 图例项目列数,默认为1
- 图例项目列间距(相对于字体大小),默认rcParams["legend.columnspacing"]=2
- 图例项目间的垂直距离(相对于字体大小),默认rcParams["legend.labelspacing"]=0.5
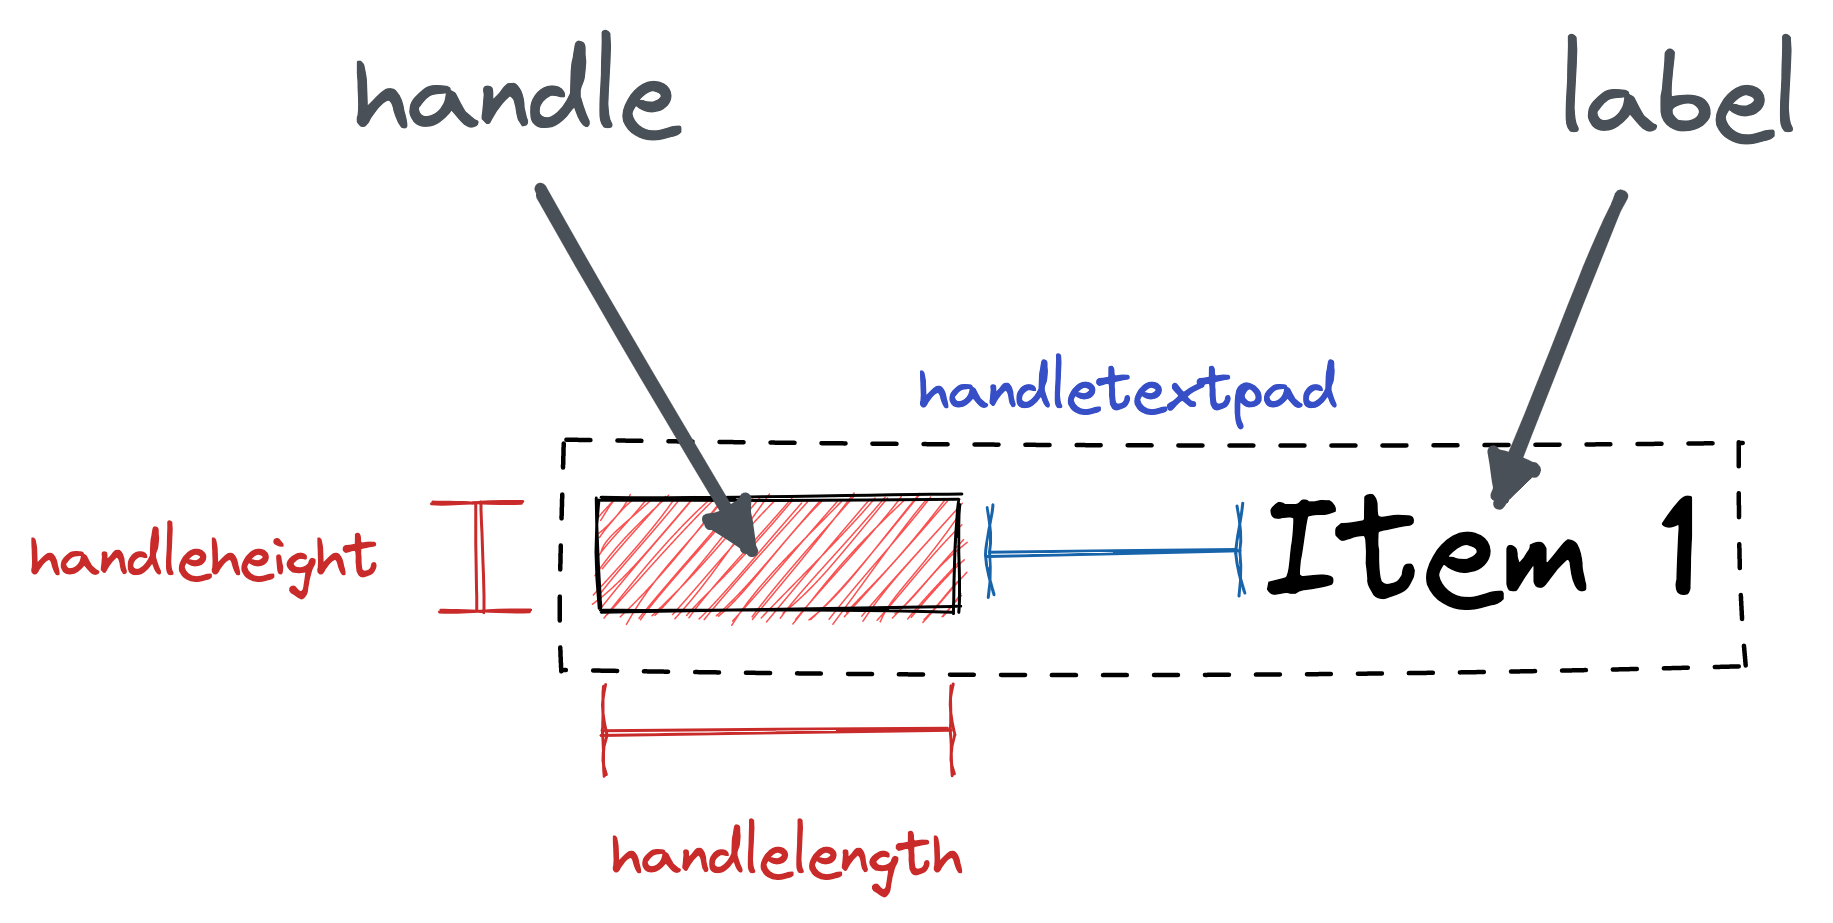
- 线形图图例项目图形中标记点数量,默认rcParams["legend.numpoints"]=1
- 散点图图例项目图形中标记点数量,默认rcParams["legend.scatterpoints"]=1
- 散点图图例项目图形中每个标记点相对于其标签文本的垂直相对偏移量,默认为[0.375, 0.5, 0.3125]
- 0表示文本底部
- 1表示文本顶部
- 图例项目图形标记点缩放,默认rcParams["legend.markerscale"]=1
- 图例项目图形是否在文本标签前面,默认True
- 是否逆转图例项目顺序,默认False
- 图例项目图形长度(相对于字体大小),默认rcParams["legend.handlelength"]=2
- 图例项目图形高度(相对于字体大小),默认rcParams["legend.handleheight"]=0.7
- 图例项目图形与标签文本之间的距离(相对于字体大小),默认rcParams["legend.handletextpad"]=0.8
- 是否绘制背景框,默认rcParams["legend.frameon"]=True
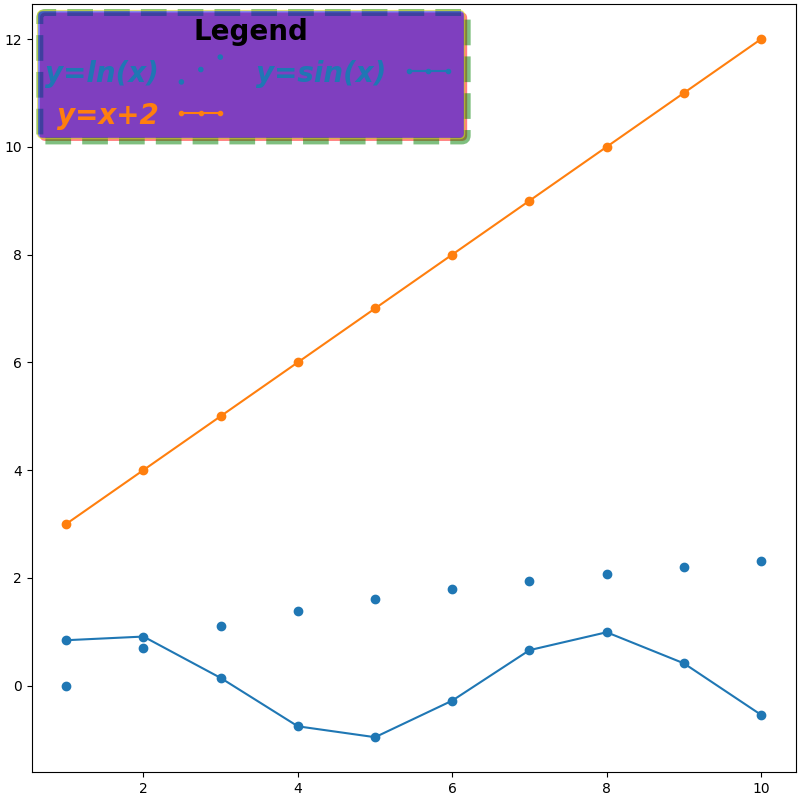
- 背景框透明度,默认rcParams["legend.framealpha"]=0.8
- 背景框填充色,默认rcParams["legend.facecolor"]="inherit"(即继承rcParams["axes.facecolor"]="white")
-
背景框边缘色,默认rcParams["legend.edgecolor"]=0.8,
若为"inherit"则继承rcParams["axes.edgecolor"]="black"
-
背景框是否启用圆角,默认rcParams["legend.fancybox"]=True
- 边框与内部的距离(相对于字体大小),默认rcParams["legend.borderpad"]=0.4
- 边框与Axes的距离(相对于字体大小),默认rcParams["legend.borderaxespad"]=0.5
- 阴影线样式
- 阴影线宽度
- 阴影填充色
- 阴影边缘色
- 可选"expand"(水平扩展到填充整个轴或bbox), None
- 通过字典映射单独设置每一个图例项目
- 图例能否被鼠标拖动,默认False
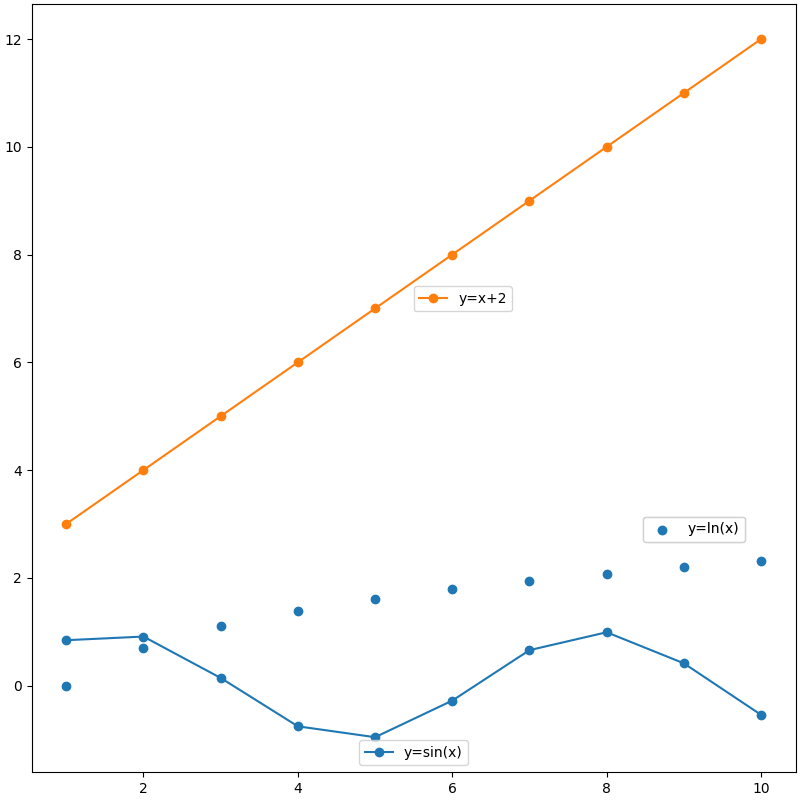
添加多个Legend
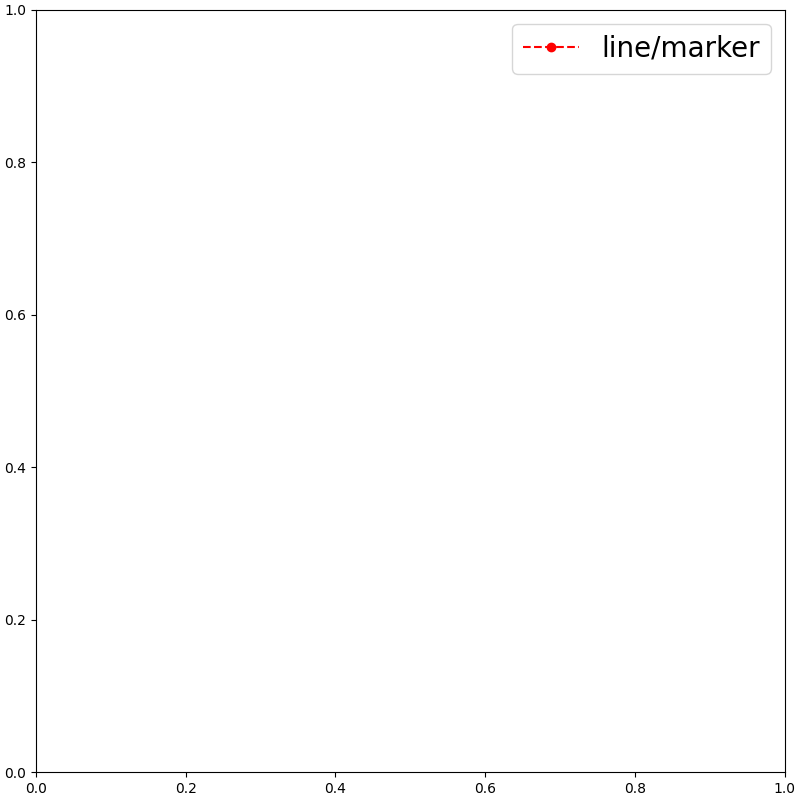
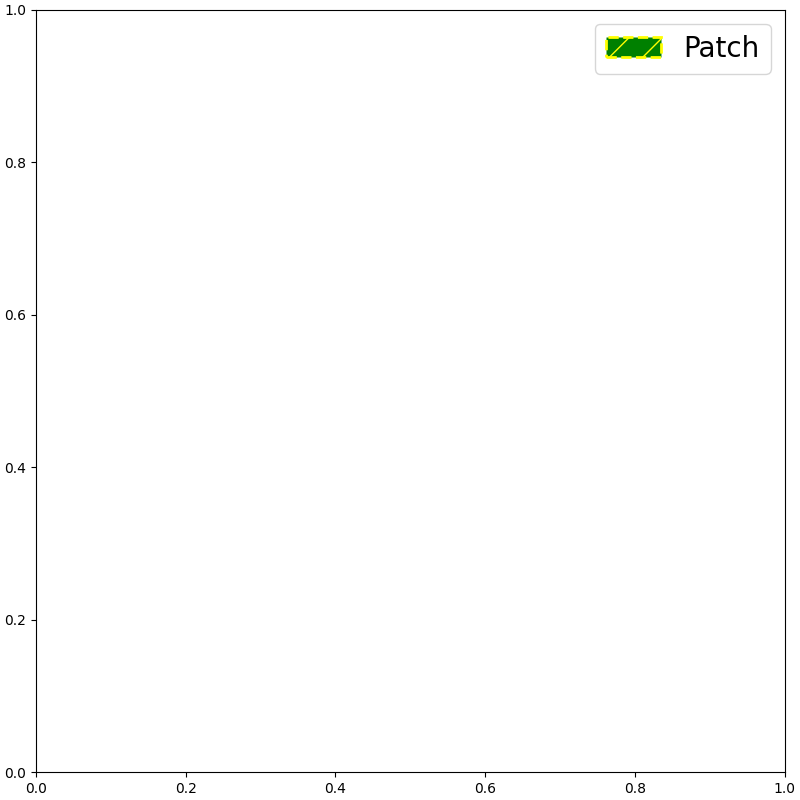
添加自定义图例
| 线型/标记图例 | |
|---|---|
获取可用handles与labels
| 获取可用handles与labels | |
|---|---|
seaborn中的move_legend函数
seaborn.move_legend — seaborn 0.13.2 documentation
重新创建一个图例到新的位置。该名称略有误称。Matplotlib 图例不公开其位置参数的控制。因此,此函数 创建一个新的图例,复制原始对象中的数据,然后删除该对象。
sns.move_legend(obj, loc, **kwargs)
-
obj:此参数可以是 seaborn 或 matplotlib 对象。
-
seaborn.FacetGrid或seaborn.PairGrid -
matplotlib.axes.Axes或matplotlib.figure.Figure
-
-
loc:位置参数,同
matplotlib.axes.Axes.legend()。
**kwargs 其他参数传递给 matplotlib.axes.Axes.legend() 。
