绘图配置(runtime configuration)
| 导入模块 | |
|---|---|
Matplotlib
matplotlibrc文件
Customizing Matplotlib with style sheets and rcParams — Matplotlib 3.10.1 documentation
matplotlib — Matplotlib 3.10.1 documentation
| 文件路径查看 | |
|---|---|
Matplotlib 使用 matplotlibrc 配置文件来自定义所有类型的属性,称为'rc 设置'或'rc 参数'。几乎可以控制 Matplotlib 中几乎每个属性的默认值:图形大小和 DPI、线宽、颜色和样式、坐标轴和网格属性、文本和字体属性等等。 matplotlibrc 在启动时读取以配置 Matplotlib。
matplotlib通过以下优先级顺序搜索对应目录下的matplotlibrc文件并读取,找到后不再搜索其它目录:
-
【!推荐】当前工作目录:仅用于当前工作目录下的配置
-
【!推荐】环境变量
MATPLOTLIBRC指向的目录 -
C:/Users/用户名/.config/matplotlib/目录 -
python安装目录/Lib/site-packages/matplotlib/mpl-data/目录(如上):该目录下的matplotlibrc文件在每次更新或安装matplotlib时都会被覆盖。该处文件不建议修改。
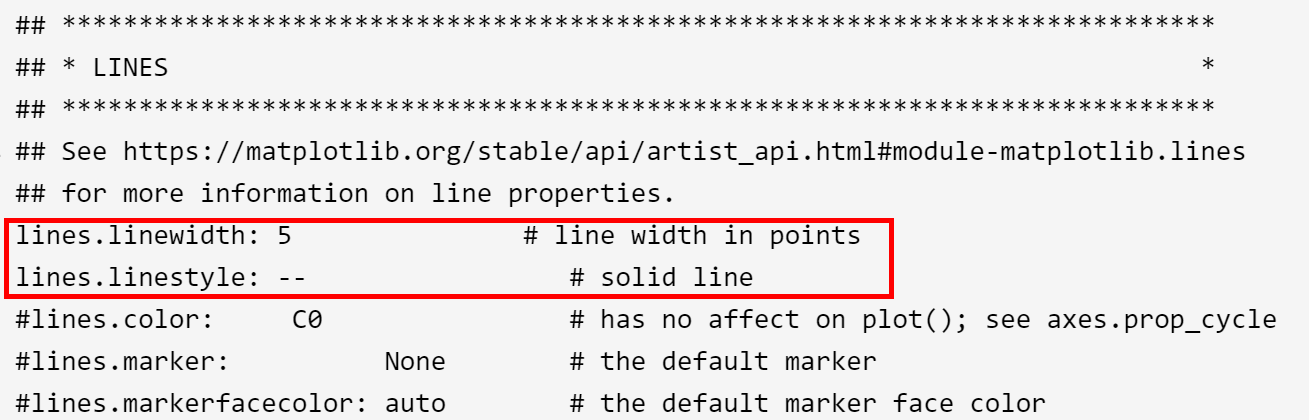
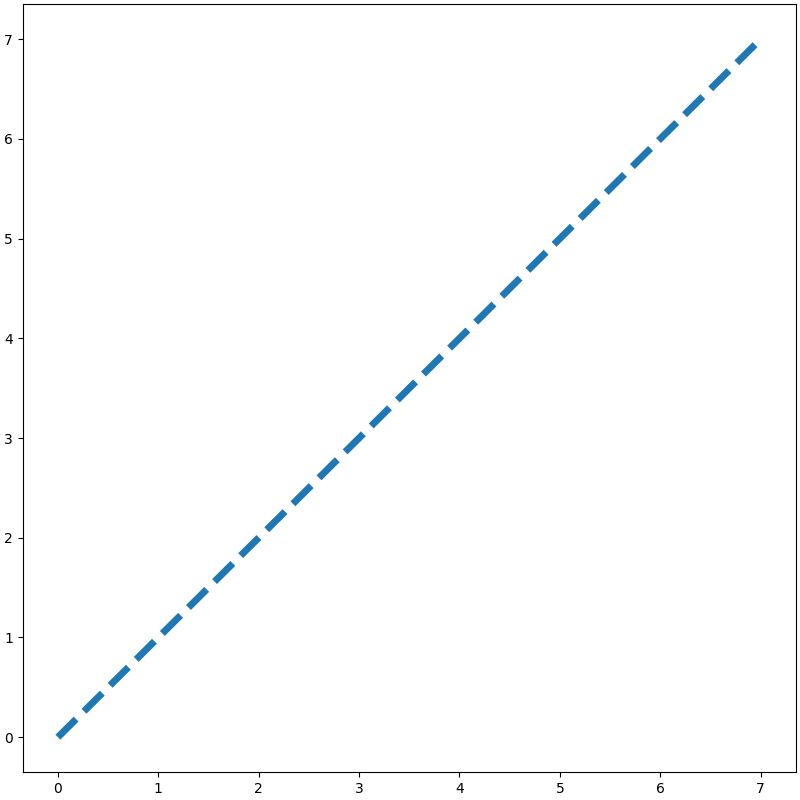
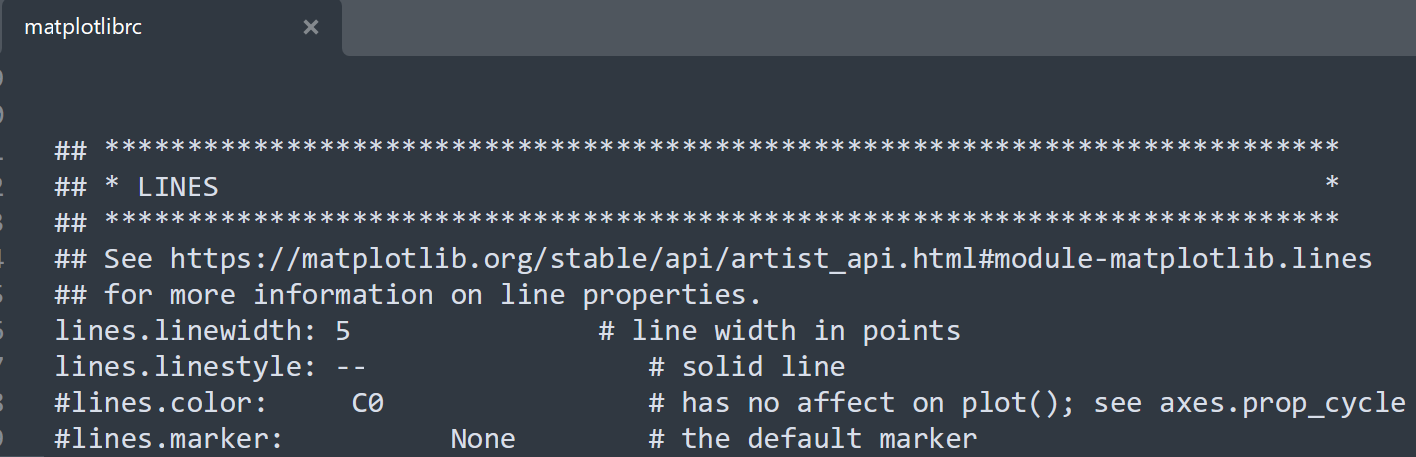
可以通过复制并修改该文件实现永久修改配置 (静态修改),以获得属于自己的配置文件。(修改时注意删除开头注释符号)
| matplotlibrc | |
|---|---|
1 2 3 4 5 6 7 8 9 10 11 12 13 14 15 16 17 18 19 20 21 22 23 24 25 26 27 28 29 30 31 32 33 34 35 36 37 38 39 40 41 42 43 44 45 46 47 48 49 50 51 52 53 54 55 56 57 58 59 60 61 62 63 64 65 66 67 68 69 70 71 72 73 74 75 76 77 78 79 80 81 82 83 84 85 86 87 88 89 90 91 92 93 94 95 96 97 98 99 100 101 102 103 104 105 106 107 108 109 110 111 112 113 114 115 116 117 118 119 120 121 122 123 124 125 126 127 128 129 130 131 132 133 134 135 136 137 138 139 140 141 142 143 144 145 146 147 148 149 150 151 152 153 154 155 156 157 158 159 160 161 162 163 164 165 166 167 168 169 170 171 172 173 174 175 176 177 178 179 180 181 182 183 184 185 186 187 188 189 190 191 192 193 194 195 196 197 198 199 200 201 202 203 204 205 206 207 208 209 210 211 212 213 214 215 216 217 218 219 220 221 222 223 224 225 226 227 228 229 230 231 232 233 234 235 236 237 238 239 240 241 242 243 244 245 246 247 248 249 250 251 252 253 254 255 256 257 258 259 260 261 262 263 264 265 266 267 268 269 270 271 272 273 274 275 276 277 278 279 280 281 282 283 284 285 286 287 288 289 290 291 292 293 294 295 296 297 298 299 300 301 302 303 304 305 306 307 308 309 310 311 312 313 314 315 316 317 318 319 320 321 322 323 324 325 326 327 328 329 330 331 332 333 334 335 336 337 338 339 340 341 342 343 344 345 346 347 348 349 350 351 352 353 354 355 356 357 358 359 360 361 362 363 364 365 366 367 368 369 370 371 372 373 374 375 376 377 378 379 380 381 382 383 384 385 386 387 388 389 390 391 392 393 394 395 396 397 398 399 400 401 402 403 404 405 406 407 408 409 410 411 412 413 414 415 416 417 418 419 420 421 422 423 424 425 426 427 428 429 430 431 432 433 434 435 436 437 438 439 440 441 442 443 444 445 446 447 448 449 450 451 452 453 454 455 456 457 458 459 460 461 462 463 464 465 466 467 468 469 470 471 472 473 474 475 476 477 478 479 480 481 482 483 484 485 486 487 488 489 490 491 492 493 494 495 496 497 498 499 500 501 502 503 504 505 506 507 508 509 510 511 512 513 514 515 516 517 518 519 520 521 522 523 524 525 526 527 528 529 530 531 532 533 534 535 536 537 538 539 540 541 542 543 544 545 546 547 548 549 550 551 552 553 554 555 556 557 558 559 560 561 562 563 564 565 566 567 568 569 570 571 572 573 574 575 576 577 578 579 580 581 582 583 584 585 586 587 588 589 590 591 592 593 594 595 596 597 598 599 600 601 602 603 604 605 606 607 608 609 610 611 612 613 614 615 616 617 618 619 620 621 622 623 624 625 626 627 628 629 630 631 632 633 634 635 636 637 638 639 640 641 642 643 644 645 646 647 648 649 650 651 652 653 654 655 656 657 658 659 660 661 662 663 664 665 666 667 668 669 670 671 672 673 674 675 676 677 678 679 680 681 682 683 684 685 686 687 688 689 690 691 692 693 694 695 696 697 698 699 700 701 702 703 704 705 706 707 708 709 710 711 712 713 714 715 716 717 718 719 720 721 722 723 724 725 726 727 728 729 730 731 732 733 734 735 736 737 738 739 740 741 742 743 744 745 746 747 748 749 750 751 752 753 754 755 756 757 758 759 760 761 762 763 764 765 766 767 768 769 770 771 772 773 774 775 776 777 778 779 780 781 782 783 784 785 786 787 788 789 790 791 792 793 794 795 796 797 798 799 800 801 802 803 804 805 806 807 808 809 810 811 812 813 | |
| 例 | |
|---|---|
rc设置
Customizing Matplotlib with style sheets and rcParams — Matplotlib 3.10.1 documentation
rcParams字典
matplotlib — Matplotlib 3.8.0 documentation
matplotlib — Matplotlib 3.10.1 documentation
mpl.rcParams将从matplotlibrc文件读取的的元素属性储存在一个字典中,通过对字典键值对的修改,实现在当前代码项目中修改全局配置(动态修改),不会对matplotlibrc文件产生修改。
| rcParams字典 | |
|---|---|
1 2 3 4 5 6 7 8 9 10 11 12 13 14 15 16 17 18 19 20 21 22 23 24 25 26 27 28 29 30 31 32 33 34 35 36 37 38 39 40 41 42 43 44 45 46 47 48 49 50 51 52 53 54 55 56 57 58 59 60 61 62 63 64 65 66 67 68 69 70 71 72 73 74 75 76 77 78 79 80 81 82 83 84 85 86 87 88 89 90 91 92 93 94 95 96 97 98 99 100 101 102 103 104 105 106 107 108 109 110 111 112 113 114 115 116 117 118 119 120 121 122 123 124 125 126 127 128 129 130 131 132 133 134 135 136 137 138 139 140 141 142 143 144 145 146 147 148 149 150 151 152 153 154 155 156 157 158 159 160 161 162 163 164 165 166 167 168 169 170 171 172 173 174 175 176 177 178 179 180 181 182 183 184 185 186 187 188 189 190 191 192 193 194 195 196 197 198 199 200 201 202 203 204 205 206 207 208 209 210 211 212 213 214 215 216 217 218 219 220 221 222 223 224 225 226 227 228 229 230 231 232 233 234 235 236 237 238 239 240 241 242 243 244 245 246 247 248 249 250 251 252 253 254 255 256 257 258 259 260 261 262 263 264 265 266 267 268 269 270 271 272 273 274 275 276 277 278 279 280 281 282 283 284 285 286 287 288 289 290 291 292 293 294 295 296 297 298 299 300 301 302 303 304 305 306 307 308 309 310 311 312 313 314 315 316 317 318 319 320 321 322 323 324 325 326 327 328 329 330 331 332 333 334 335 336 337 338 339 340 341 342 343 344 345 346 347 348 349 350 351 352 353 354 355 356 357 358 359 360 361 362 363 364 365 366 367 368 369 370 | |
| 例 | |
|---|---|
rc函数
matplotlib — Matplotlib 3.10.1 documentation
通过使用关键字参数可以一次性修改同一组中的多个设置
| rc函数 | |
|---|---|
rc_file函数
matplotlib — Matplotlib 3.10.1 documentation
从一个文件中更新设置
rc_context上下文管理器
Customizing Matplotlib with style sheets and rcParams — Matplotlib 3.10.1 documentation
matplotlib — Matplotlib 3.10.1 documentation
修改仅在局部有效,也可以用作装饰器来修改函数内的绘图设置。
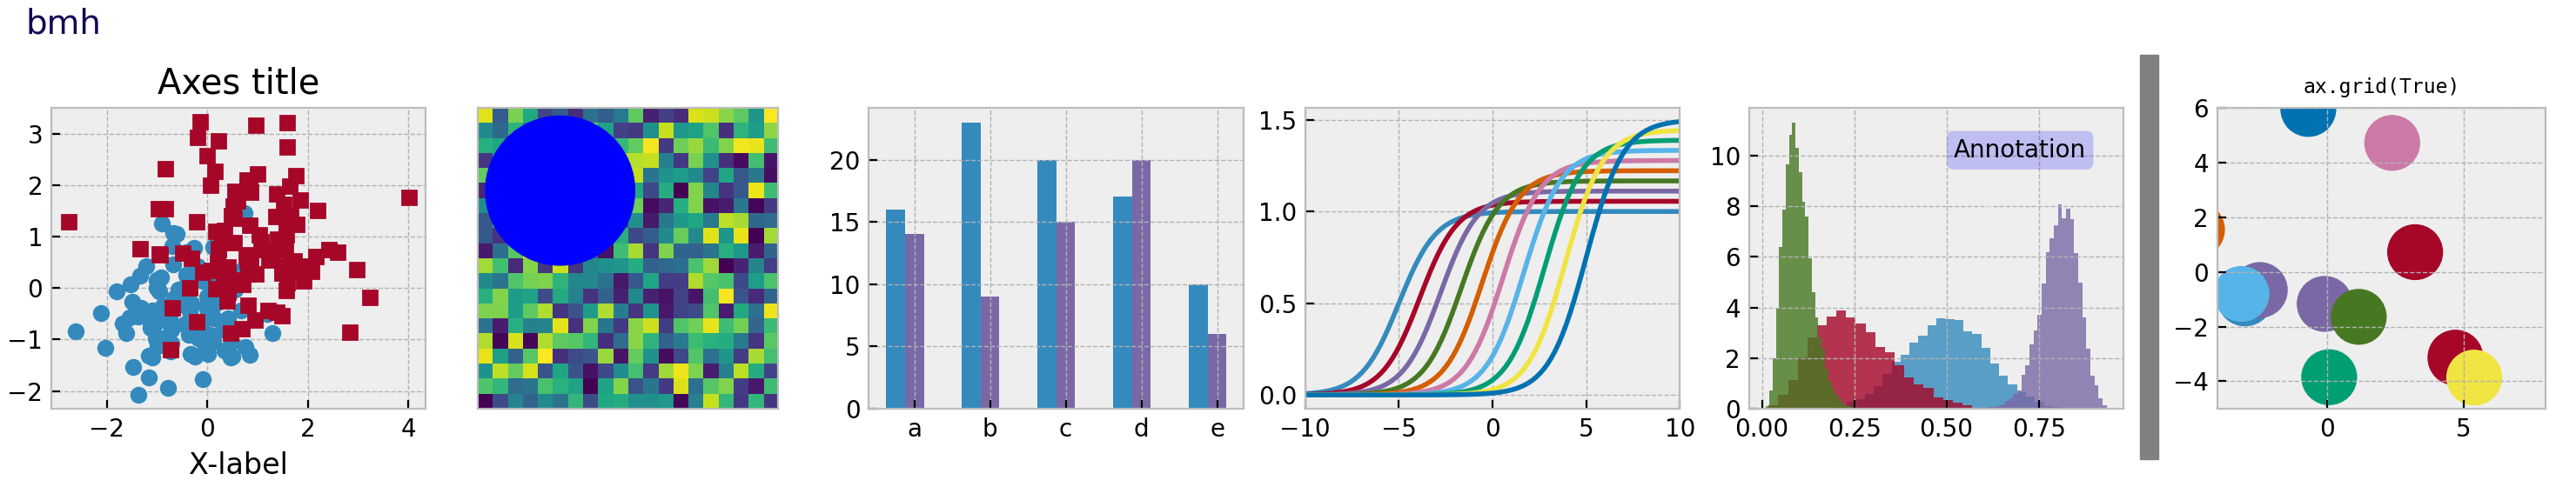
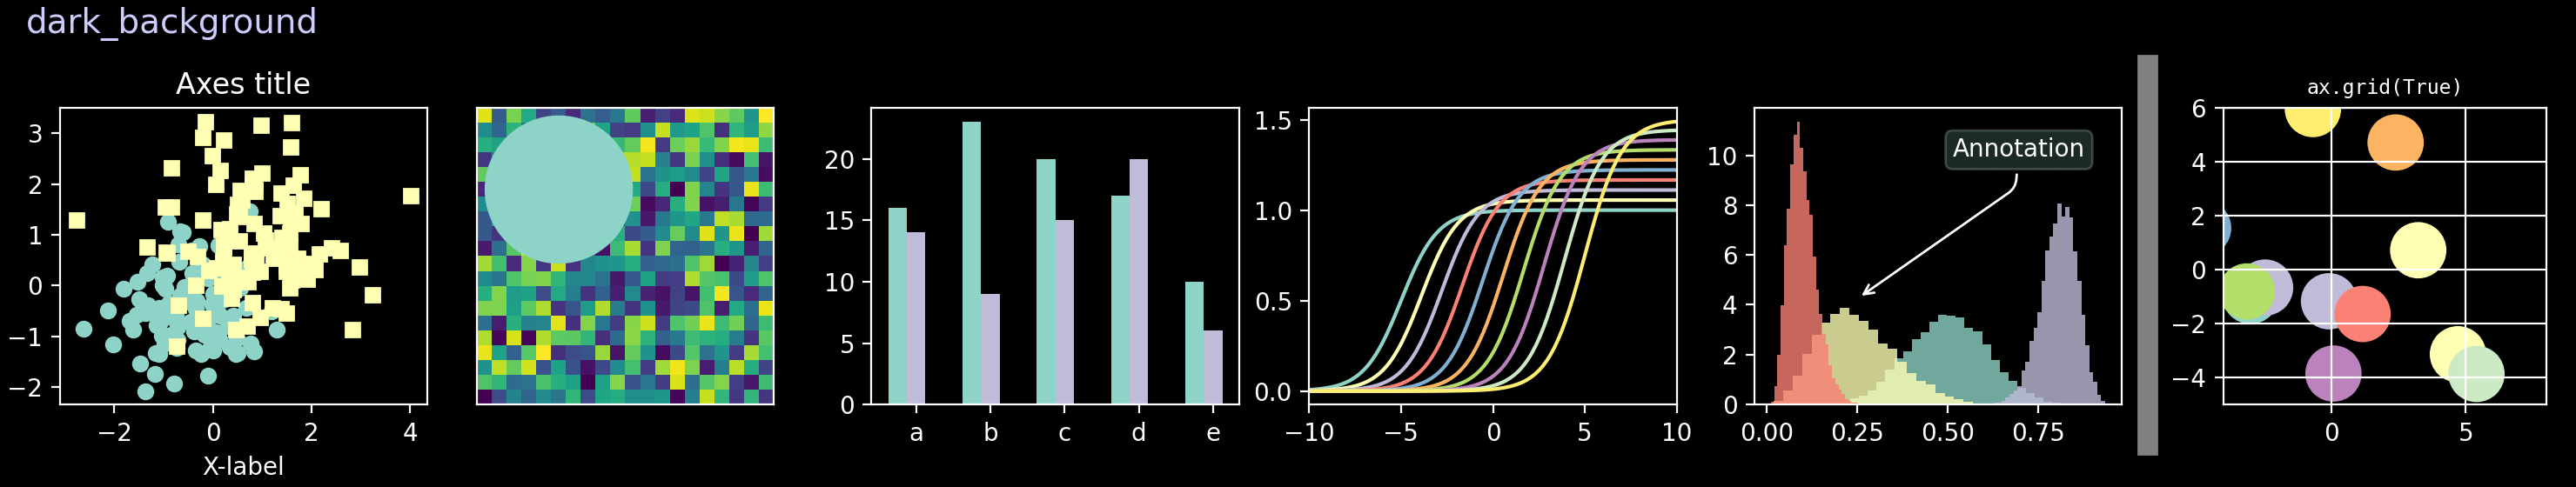
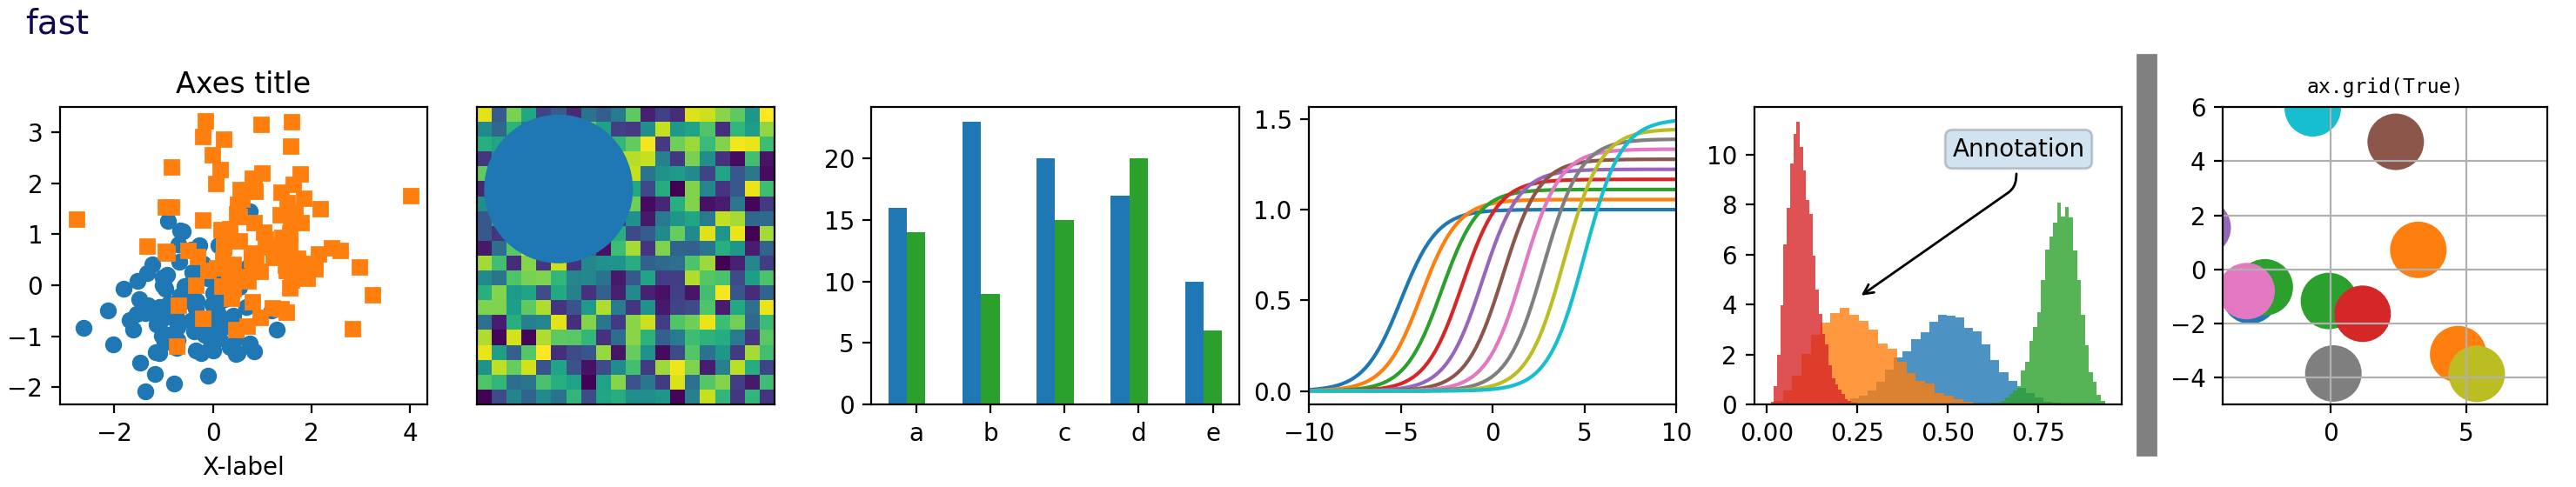
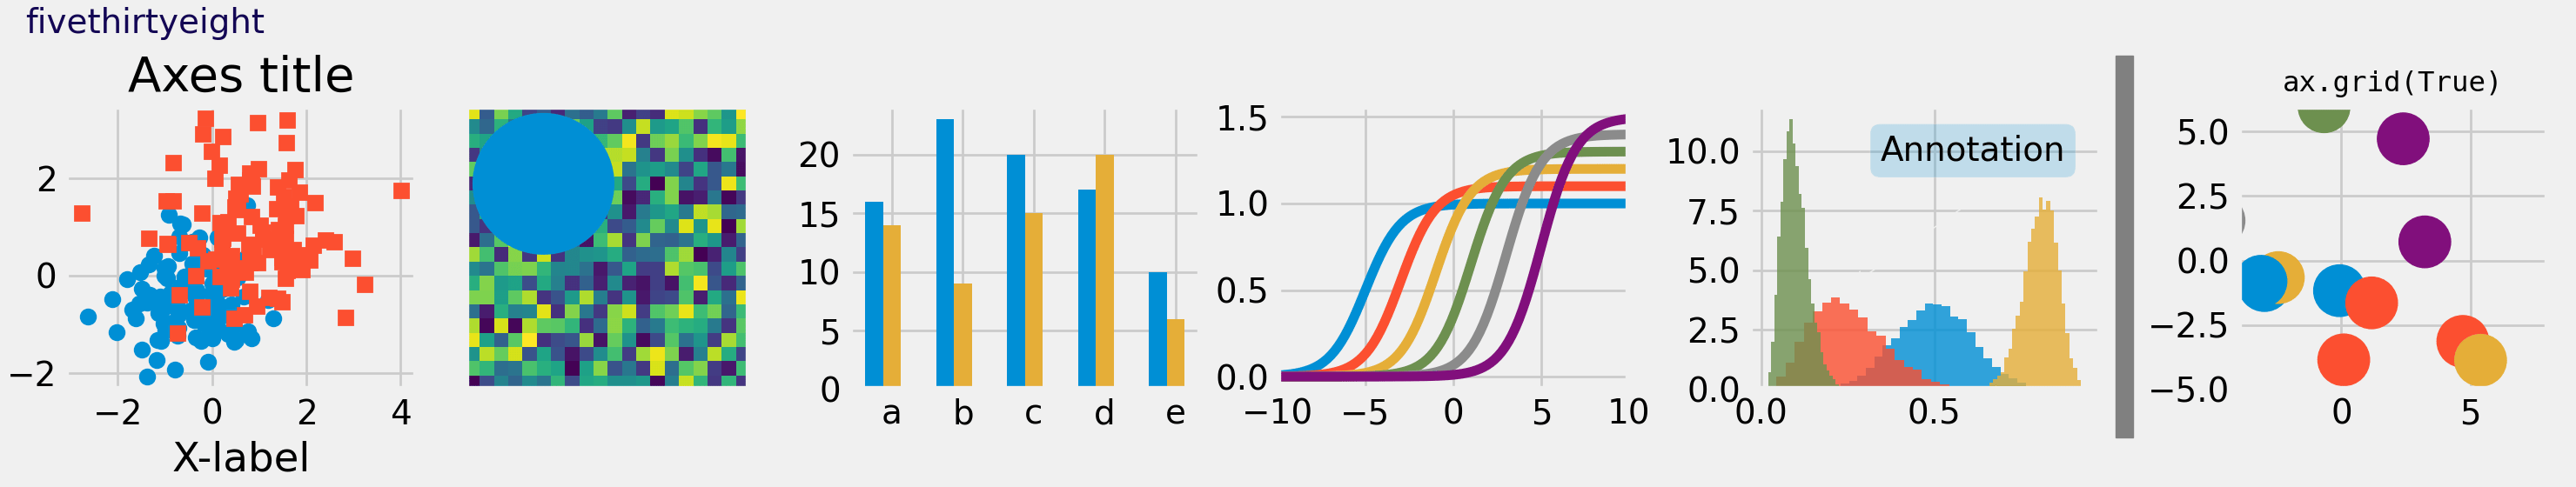
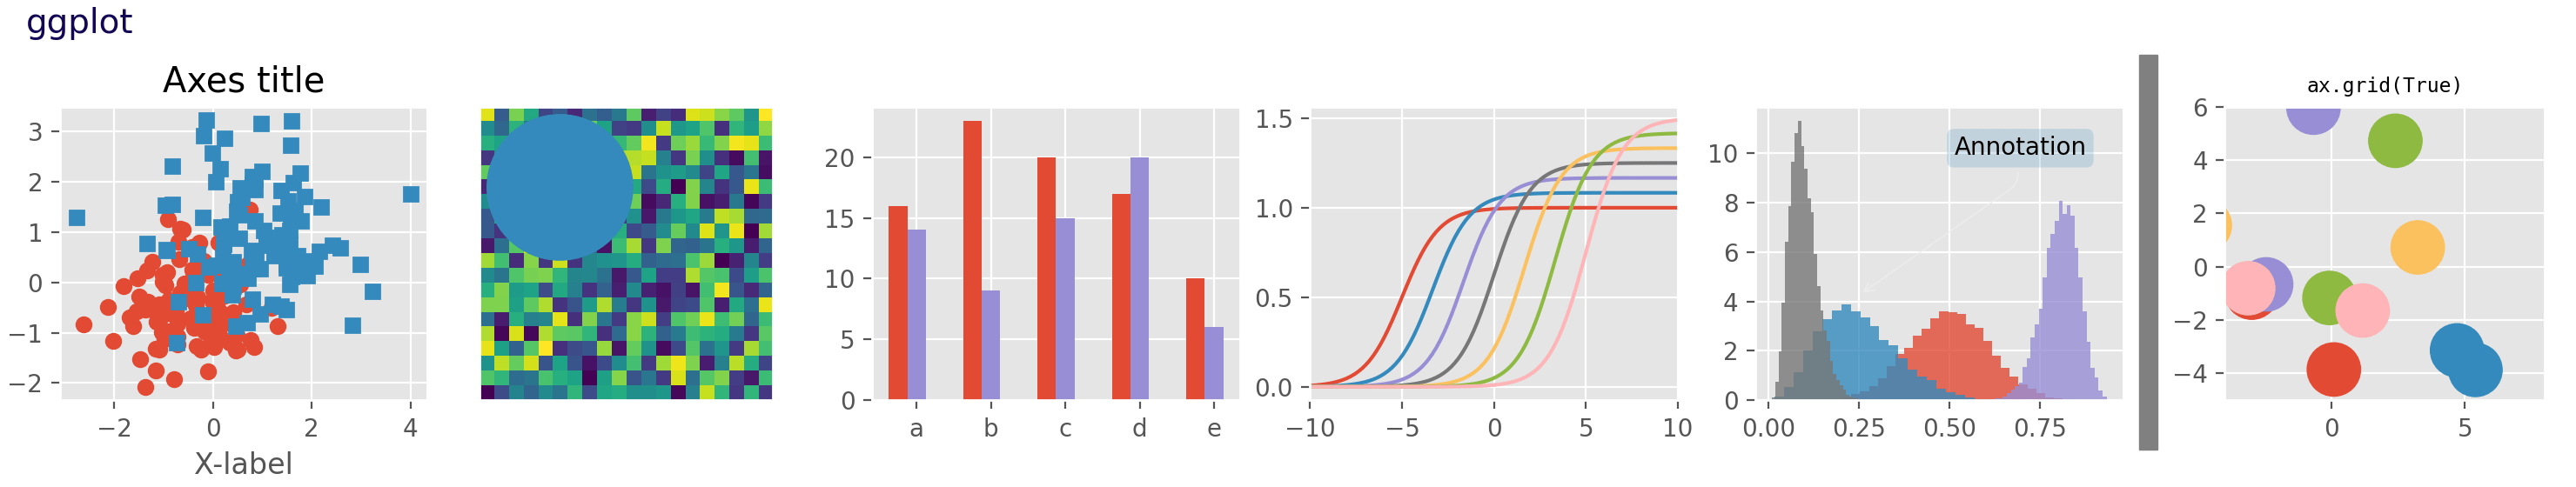
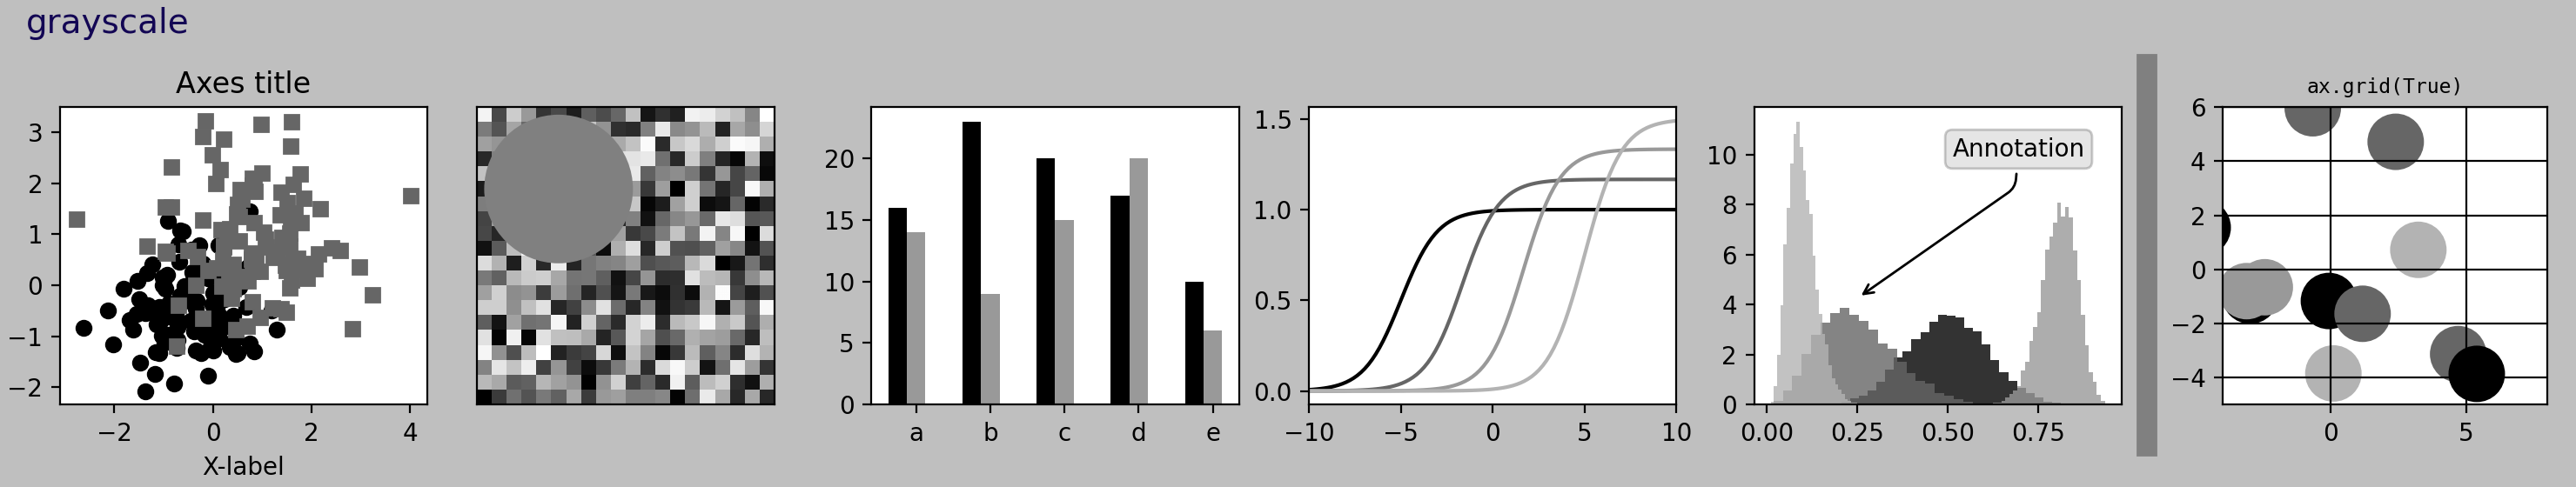
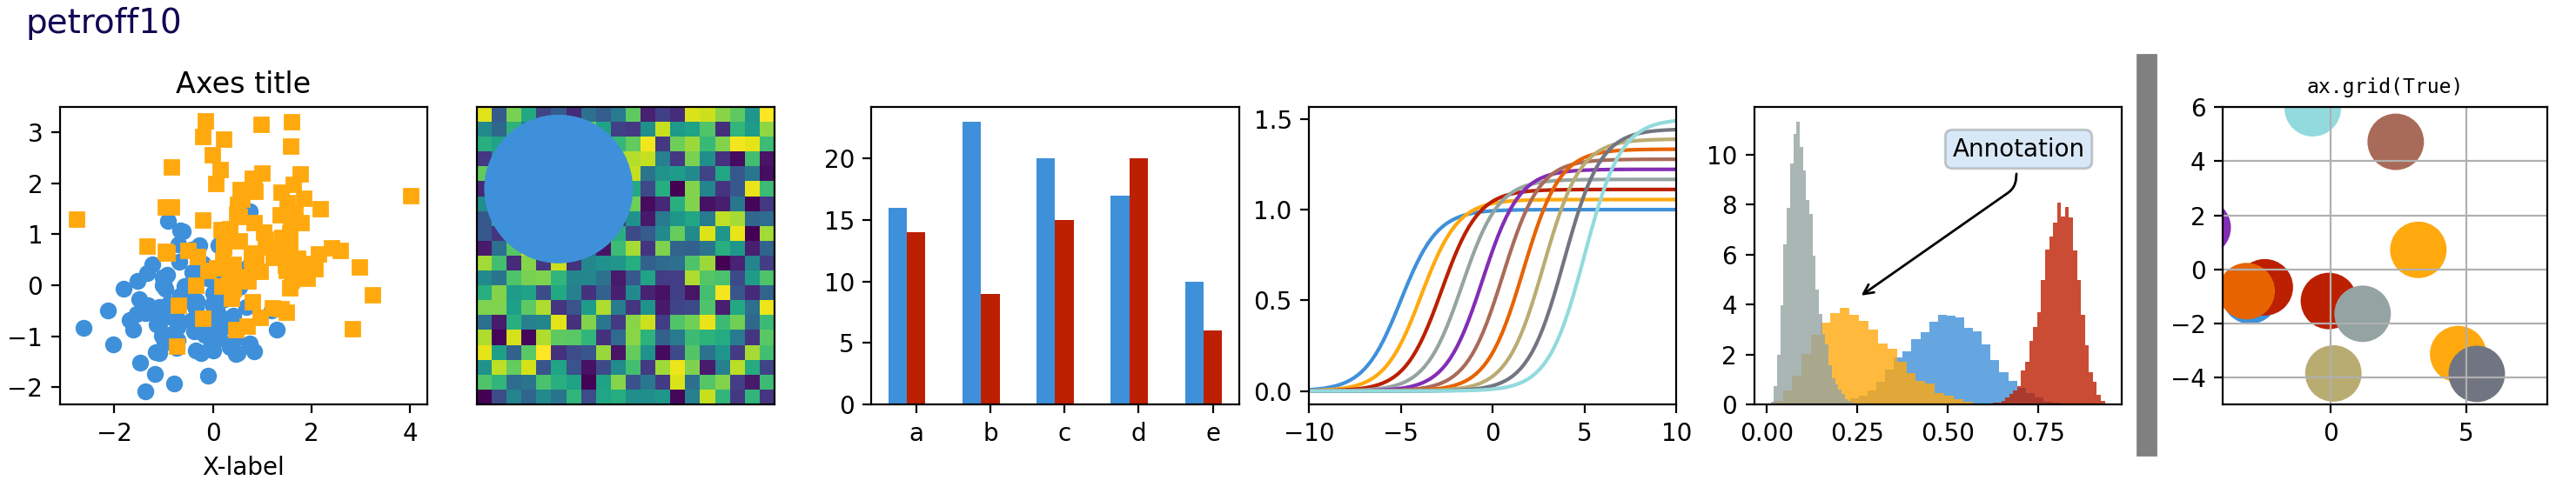
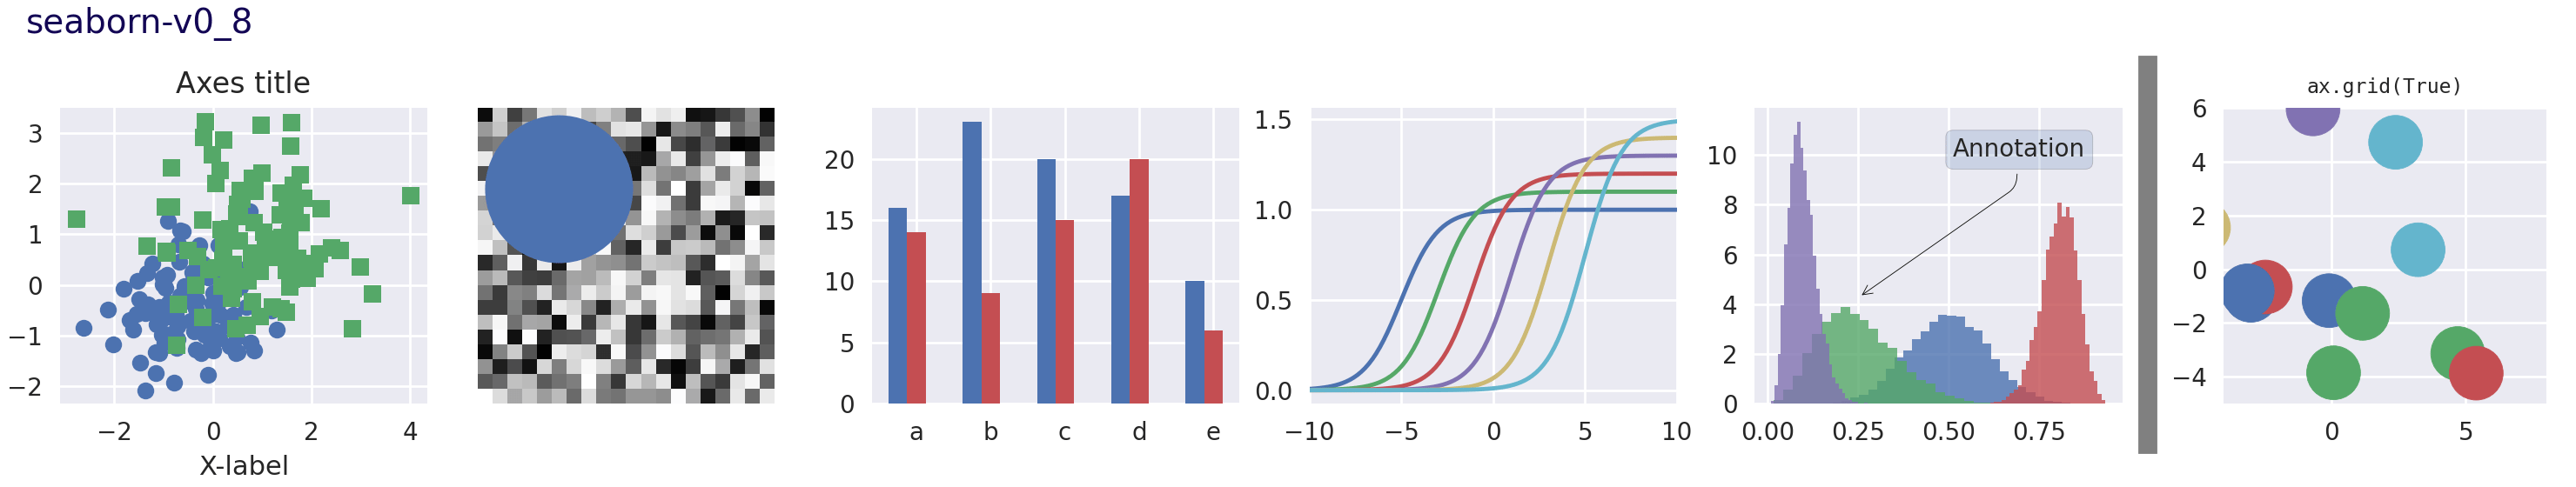
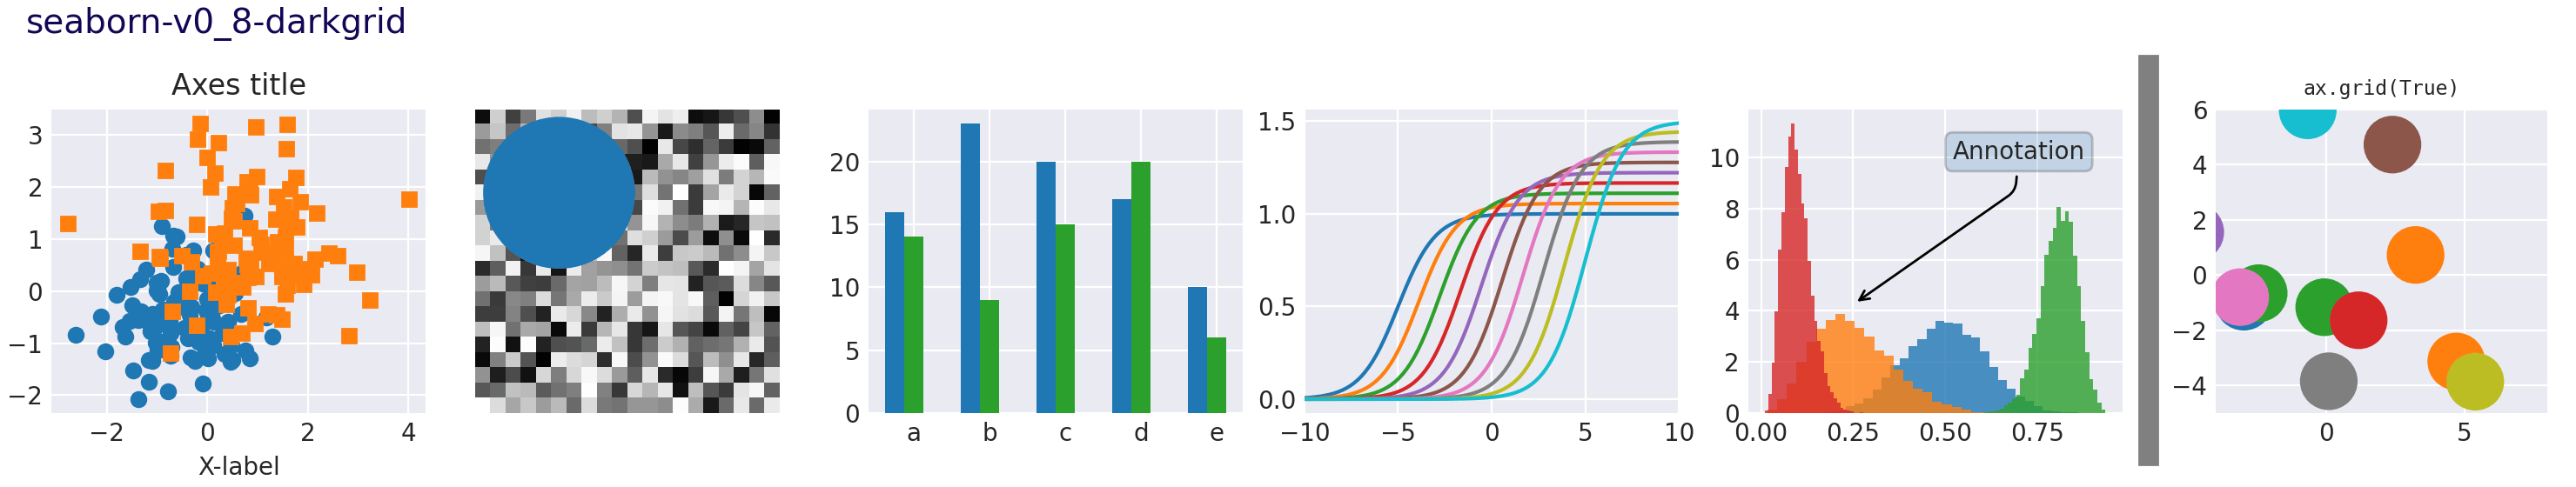
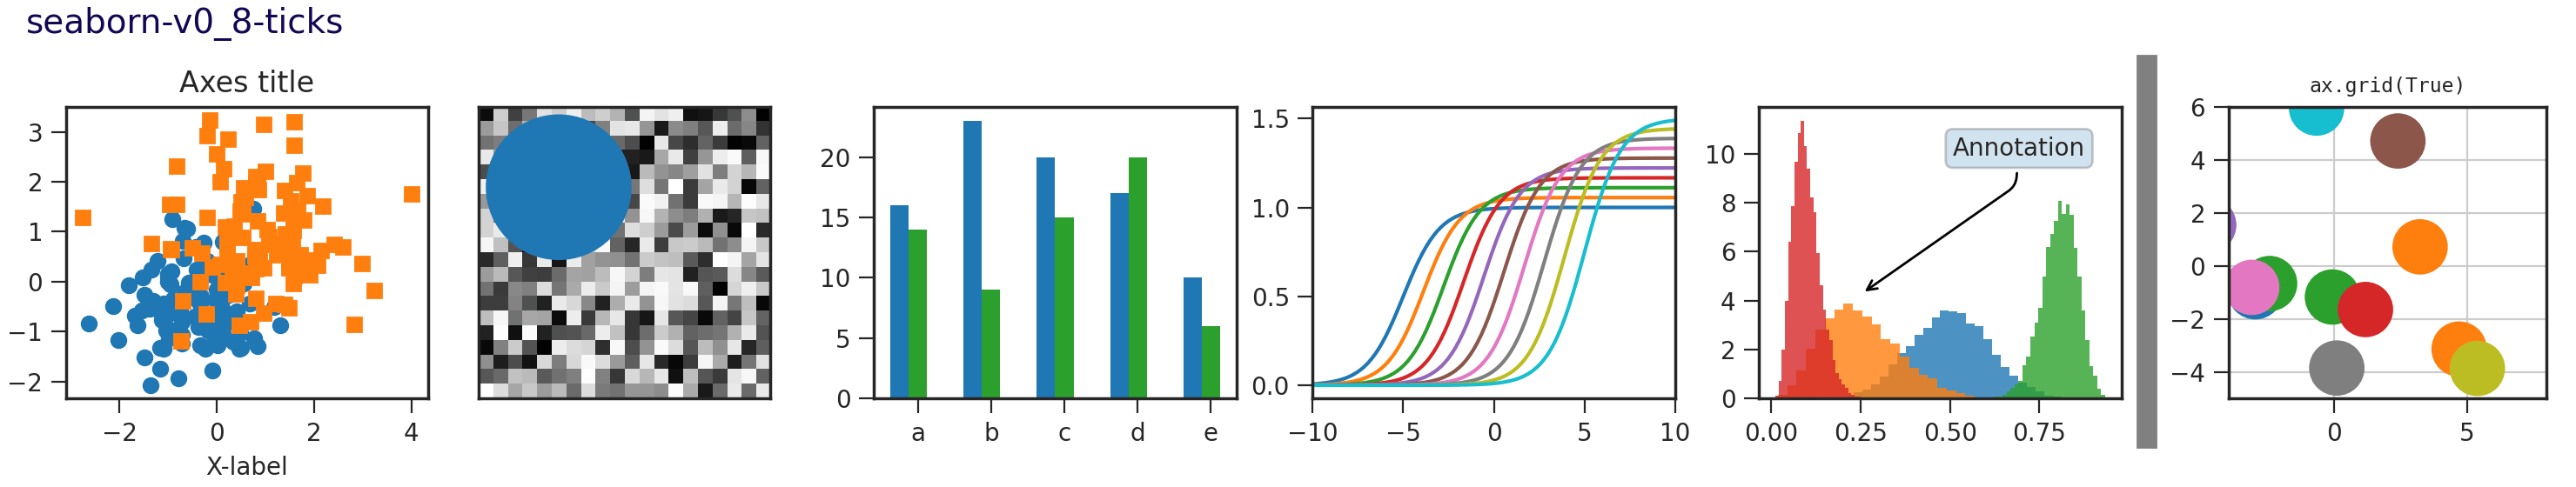
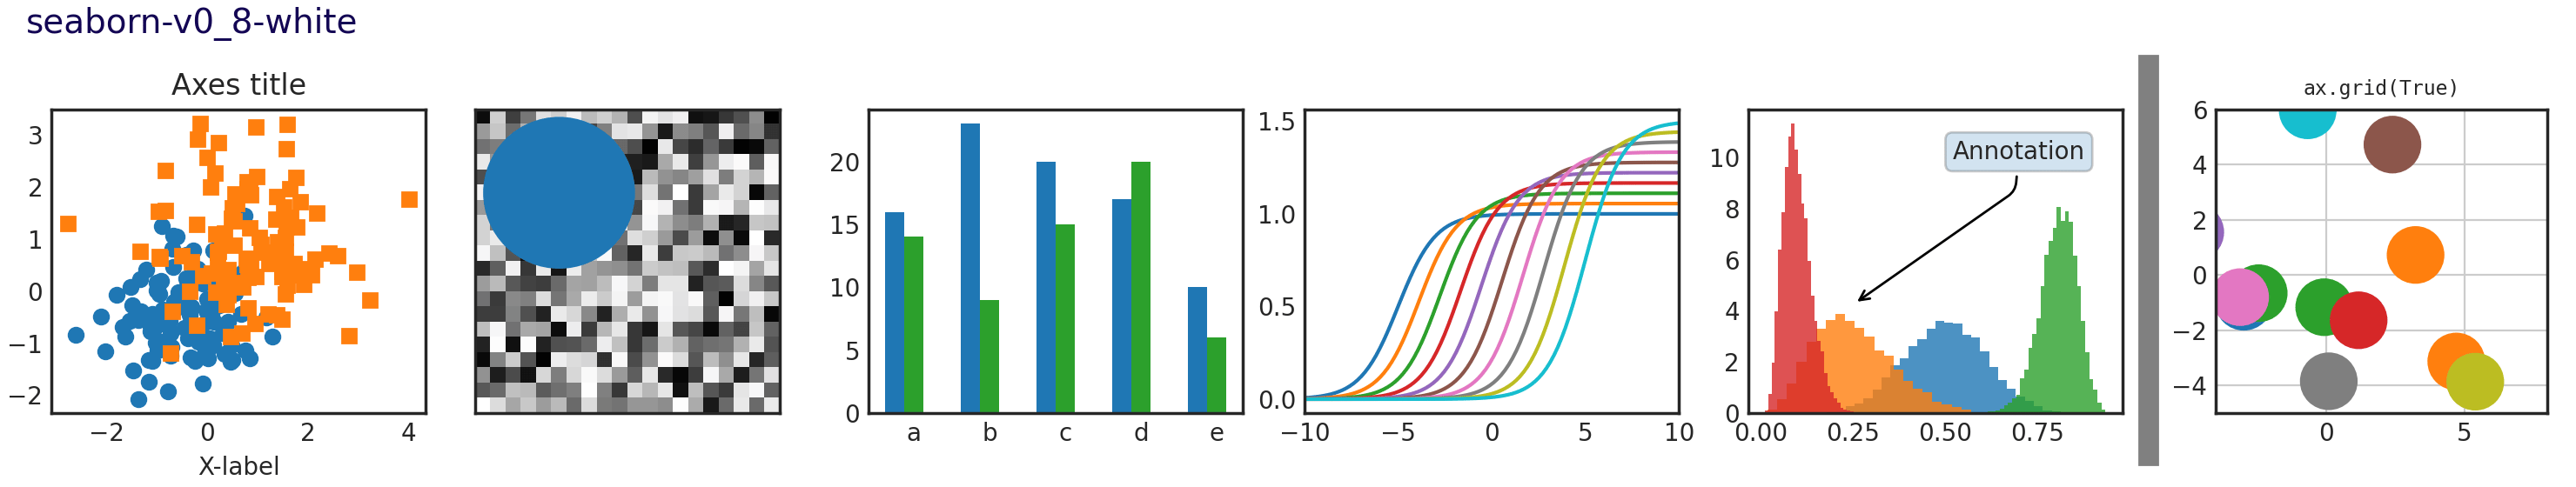
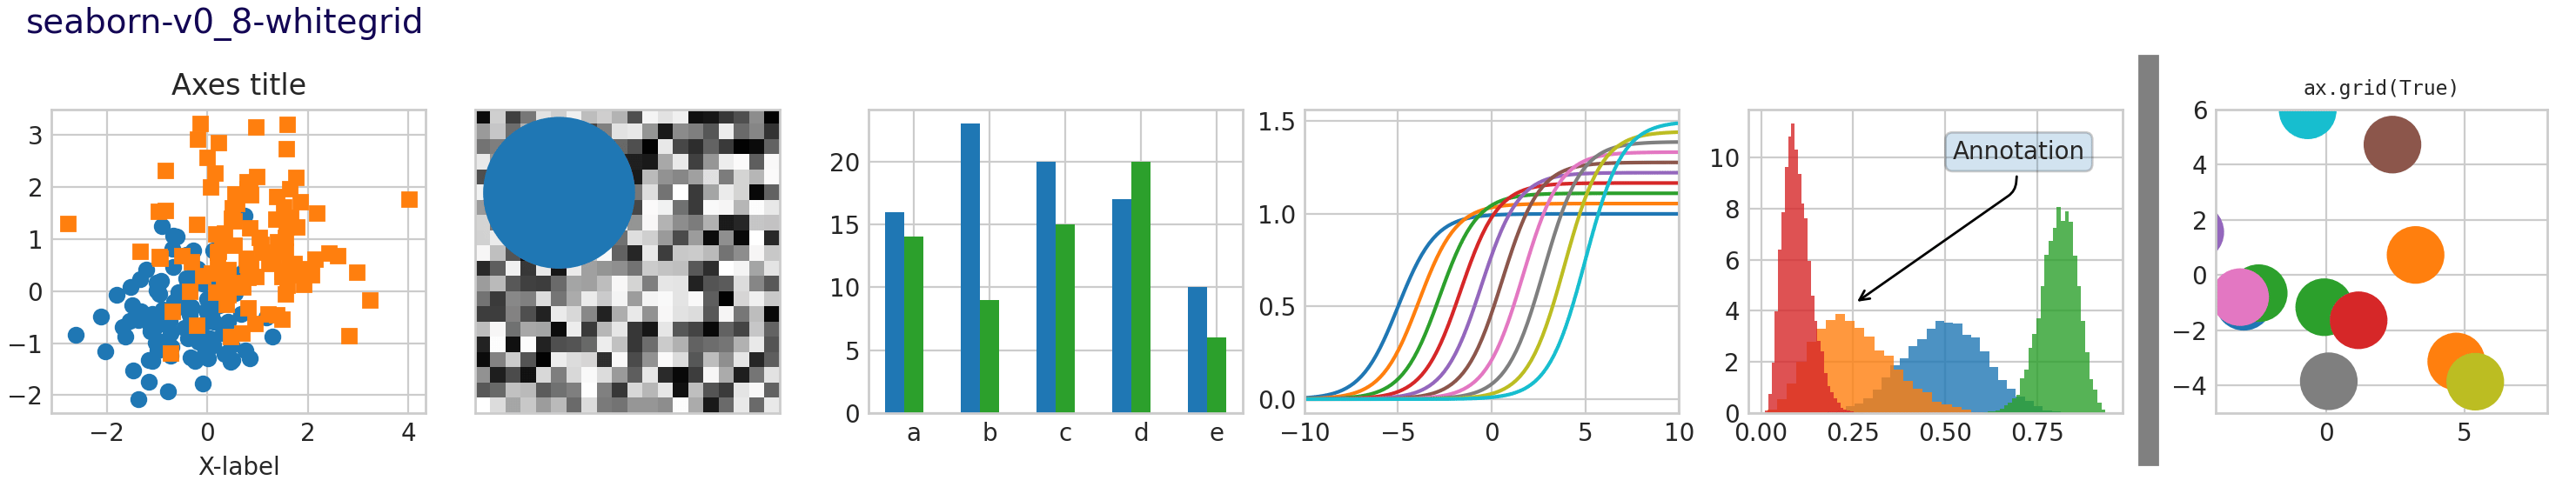
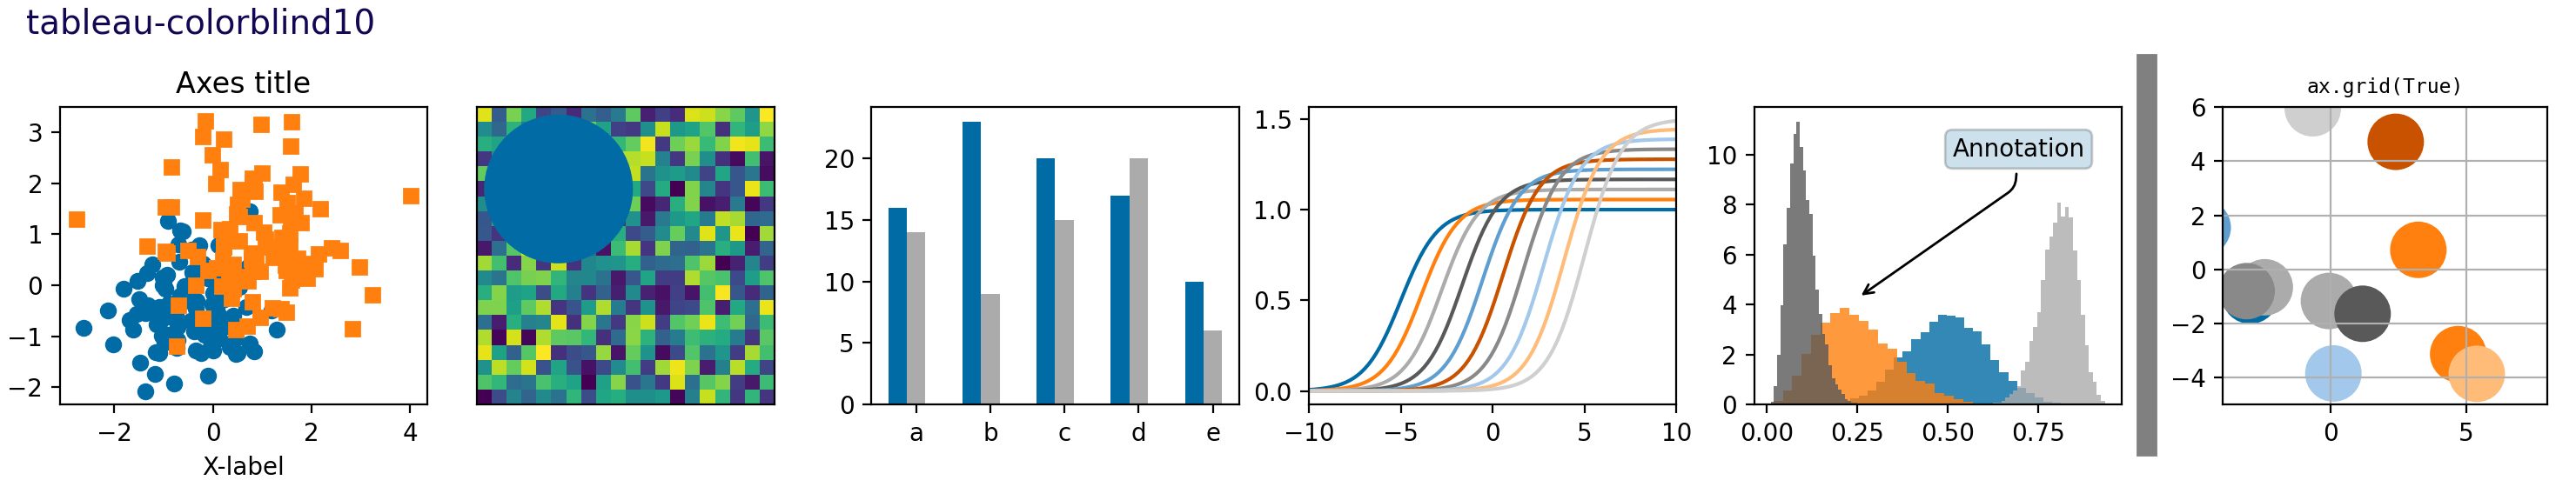
样式表(Style Sheets)
Customizing Matplotlib with style sheets and rcParams — Matplotlib 3.10.1 documentation
Style sheets reference — Matplotlib 3.10.1 documentation
matplotlib.style — Matplotlib 3.10.1 documentation
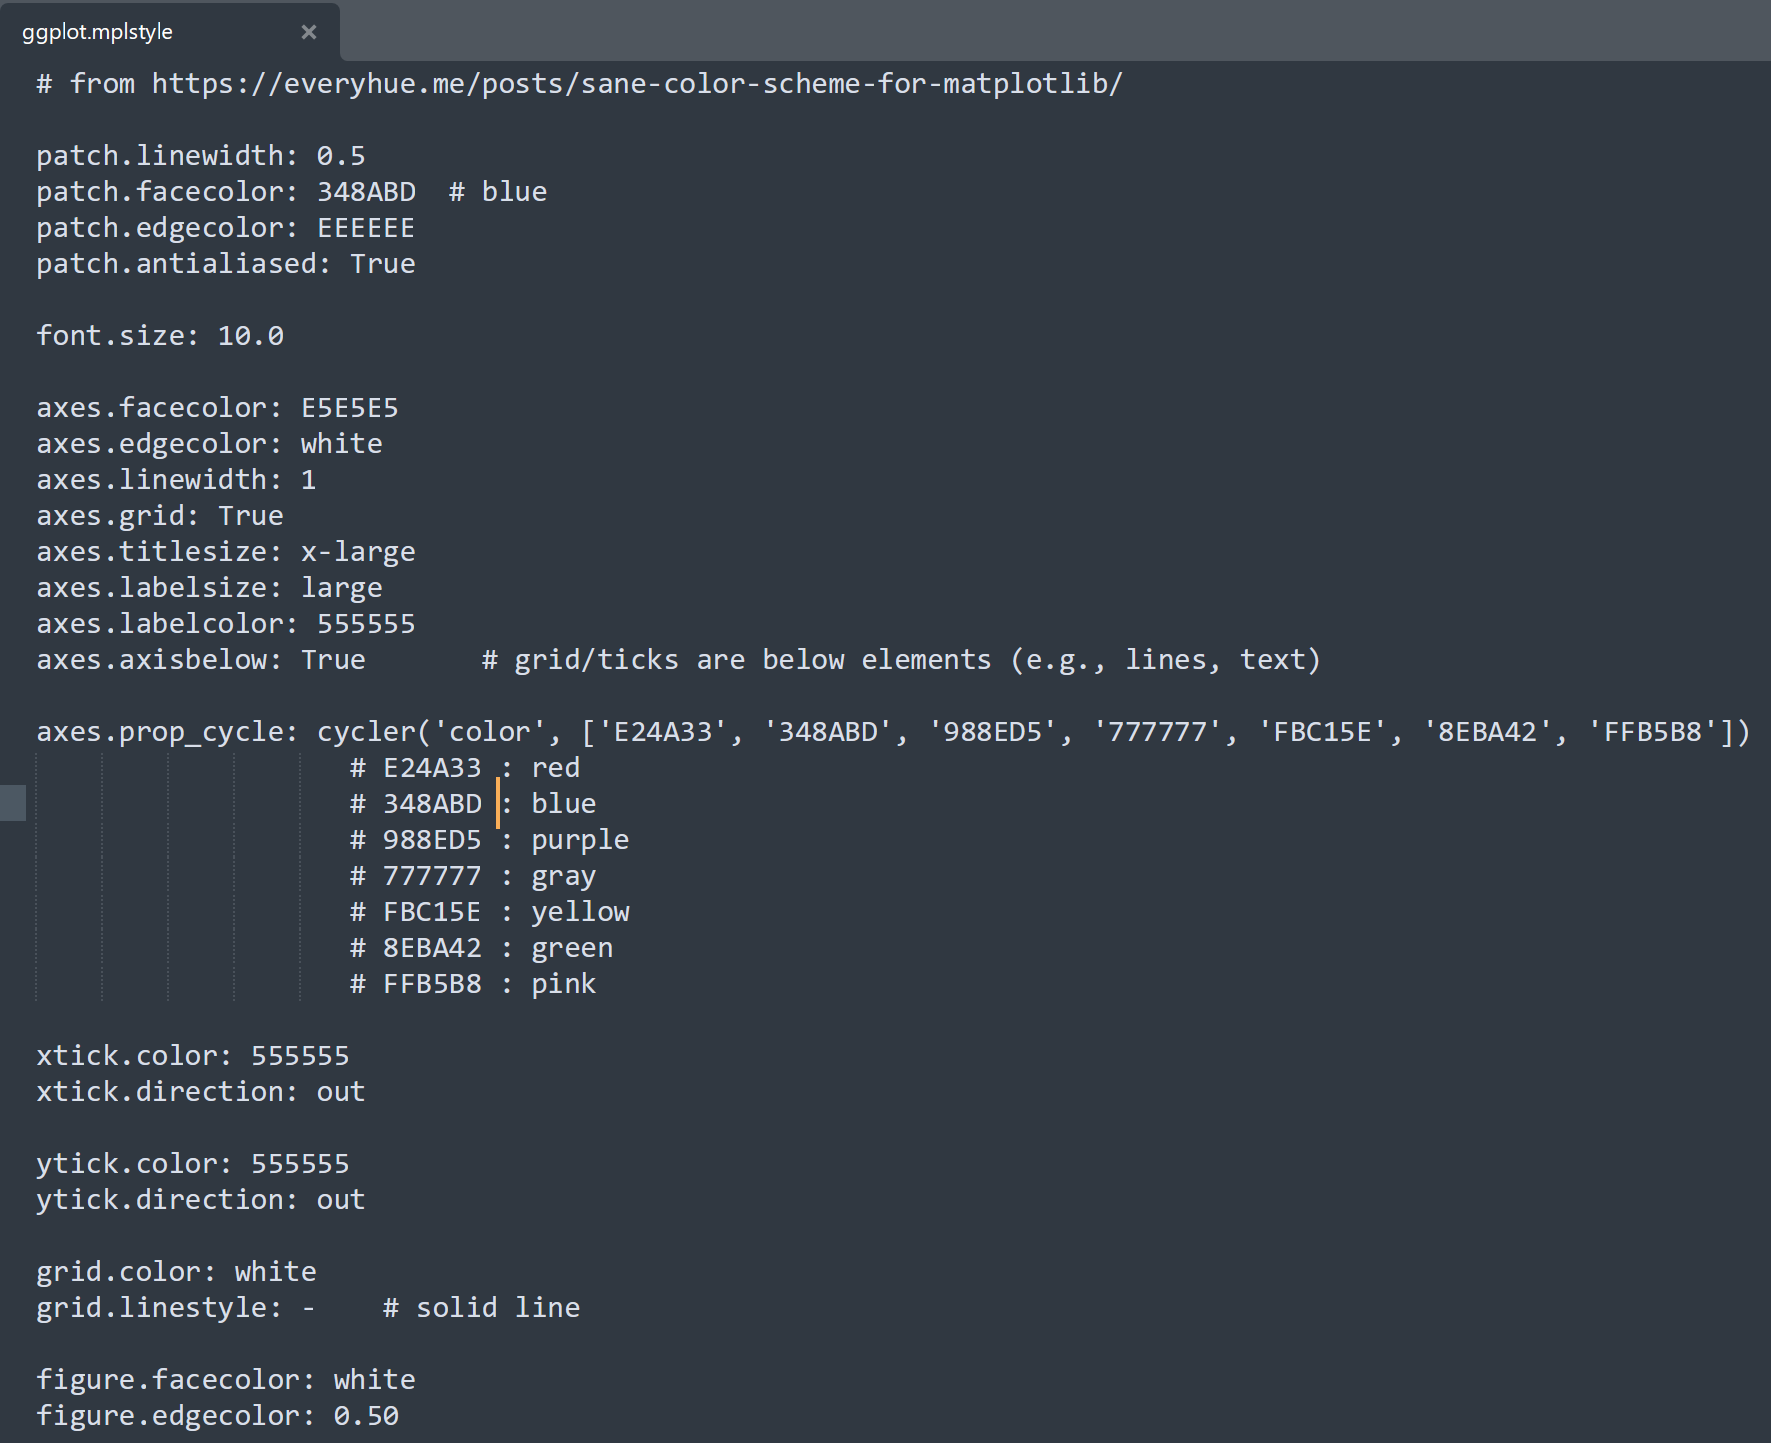
另一种改变图形视觉外观的方法是将 rcParams 设置在一个所谓的样式表中,并通过 mpl.style.use或plt.style.use 导入该样式表。这样,可以通过简单地更改导入的样式表来轻松地在不同的样式之间切换。样式表看起来与 matplotlibrc 文件相同,但在样式表中,只能设置与图形实际样式相关的 rcParams。其他 rcParams,如backend,将被忽略,而matplotlibrc 文件支持所有 rcParams。这样做的原因是为了在不同的机器之间使样式表具有可移植性,而无需担心可能在另一台机器上安装或没有安装的依赖项。样式表中的设置优先于 matplotlibrc 文件中的设置。
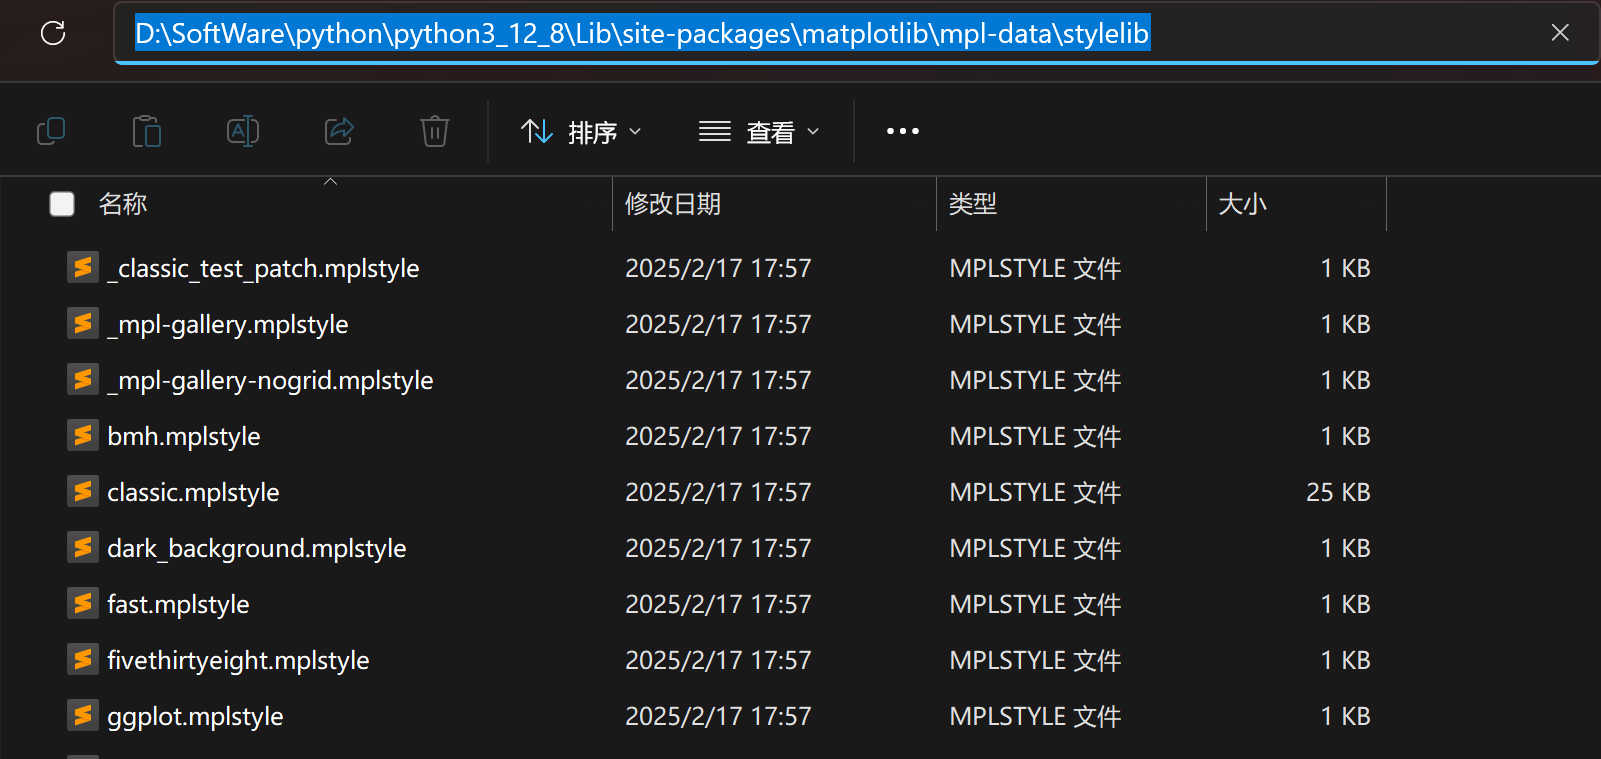
内置的样式表文件存放在"python安装目录\Lib\site-packages\matplotlib\mpl-data\stylelib"目录下,以.mplstyle为后缀。
| 样式表(Style Sheets) | |
|---|---|
1 2 3 4 5 6 7 8 9 10 11 12 13 14 15 16 17 18 19 20 21 22 23 24 25 26 27 28 29 30 31 32 33 34 35 36 37 38 39 40 41 42 43 44 45 46 47 48 49 50 51 52 53 54 55 56 57 58 59 60 61 62 63 64 65 66 67 68 69 70 71 72 73 74 75 76 77 78 79 80 81 82 83 84 85 86 87 88 89 90 91 92 93 94 95 96 97 98 99 100 101 102 103 104 105 106 107 108 109 110 111 112 113 114 115 116 117 118 119 120 121 122 123 124 125 126 127 128 129 130 131 132 133 134 135 136 137 138 139 140 141 142 143 144 145 146 147 148 149 150 151 152 153 154 155 156 157 158 159 160 161 162 163 164 165 166 167 168 169 170 171 172 173 174 175 176 177 178 179 180 181 182 183 184 185 186 187 188 189 190 191 192 193 194 195 196 197 198 199 200 201 202 203 204 205 206 207 208 209 210 211 212 213 214 215 216 217 218 219 220 221 222 223 224 225 226 227 228 229 230 231 232 233 234 235 236 237 238 239 240 241 242 243 244 245 246 247 248 249 250 251 252 253 254 255 256 257 258 259 260 261 262 263 264 265 266 267 268 269 270 271 272 273 274 275 276 277 278 279 280 281 282 283 284 285 286 287 288 289 290 291 292 293 294 295 296 297 298 299 300 301 302 303 304 305 306 307 308 309 310 311 312 313 314 315 316 317 318 319 320 321 322 323 324 325 326 327 328 329 330 331 332 333 334 335 336 337 338 339 340 341 342 343 344 345 346 347 348 349 350 351 352 353 354 355 356 357 358 359 360 361 362 363 364 365 366 367 368 369 370 371 372 373 374 375 376 377 378 379 380 381 382 383 384 385 386 387 388 389 390 391 392 393 394 395 396 397 398 399 400 401 402 403 404 405 406 407 408 409 410 411 412 413 414 415 416 417 418 419 420 421 422 423 424 425 426 427 428 429 430 431 432 433 434 435 436 437 438 439 440 441 442 443 444 445 446 447 448 449 450 451 452 453 454 455 456 457 458 459 460 461 462 463 464 465 466 467 468 469 470 471 472 473 474 475 476 477 478 479 480 481 482 483 484 485 486 487 488 489 490 491 492 493 494 495 496 497 498 499 500 501 502 503 504 505 506 507 508 509 510 511 512 513 514 515 516 517 518 519 520 521 522 523 524 525 526 527 528 529 530 531 532 533 534 535 536 537 538 539 540 541 542 543 544 545 546 547 548 549 550 551 552 553 554 555 556 557 558 559 560 561 562 563 564 565 566 567 568 569 570 571 572 573 574 575 576 577 578 579 580 581 582 583 584 585 586 587 588 589 590 591 592 593 594 595 596 597 598 599 600 601 602 603 604 605 606 607 608 609 610 611 612 613 614 615 616 617 618 619 620 621 622 623 624 625 626 627 628 629 630 631 632 633 634 635 636 637 638 639 640 641 642 643 644 645 646 647 648 649 650 651 652 653 654 655 656 657 658 659 660 661 662 663 664 665 666 667 668 669 670 671 672 673 674 675 676 677 678 679 680 681 682 683 684 685 686 687 688 689 690 691 692 693 694 695 696 697 698 699 700 701 702 703 704 705 706 707 708 709 710 711 712 713 714 715 716 717 718 719 720 721 722 723 724 725 726 727 728 729 730 731 732 733 734 735 736 737 | |

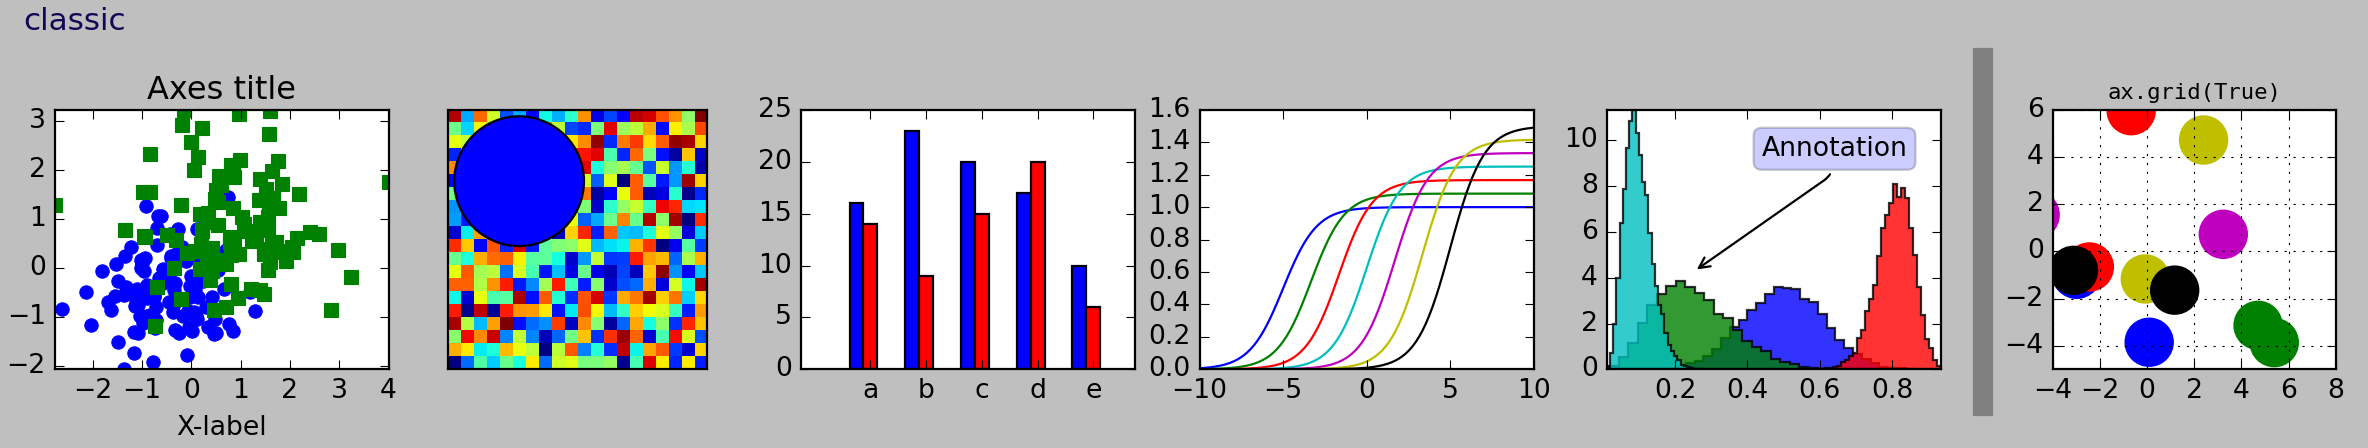
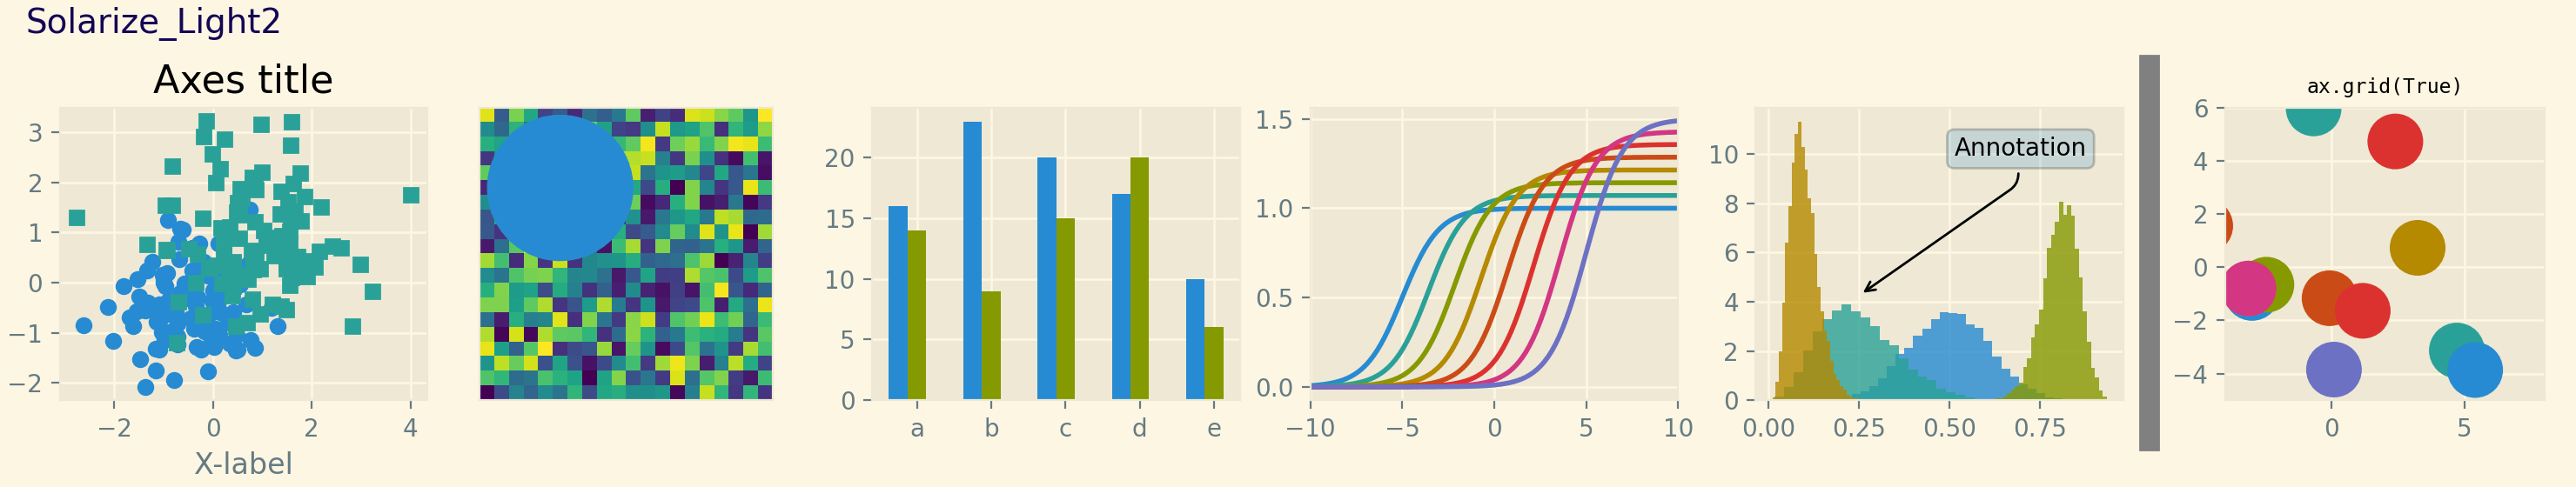
可以通过mpl.style.use或plt.style.use导入一个或多个样式(以列表形式传入多个样式表时,后一个样式表的样式将会覆盖前一个样式表中已经定义的样式)。内置的样式表可以通过名称直接导入。自定义的的样式表可以通过文件路径导入。当把自定义样式表放入mpl.get_configdir()/stylelib目录下时,也可以通过名称进行导入。注意名称尽量不要与内置样式表名称相同,这会覆盖内置样式表。同样,通过mpl.style.context或plt.style.context上下文管理器实现局部修改样式。导入样式表后将会更新mpl.rcParams字典,所以此时再更改mpl.rcParams将是在该样式表的基础上的更改。
恢复默认设置
-
mpl.rc_file_defaults()matplotlib — Matplotlib 3.10.1 documentation
恢复由 Matplotlib 加载的原始 rc 文件中的设置
-
mpl.rcdefaults()matplotlib — Matplotlib 3.10.1 documentation
恢复 Matplotlib 内部默认样式中的设置
-
mpl.style.use('default')
常用设置
| 常用设置 | |
|---|---|
Note
- SimHei中易黑体
- Kaiti中文楷体
- Lisu中文隶书
- FangSong中文仿宋
- YouYuan中文幼圆
- STSong华文宋体
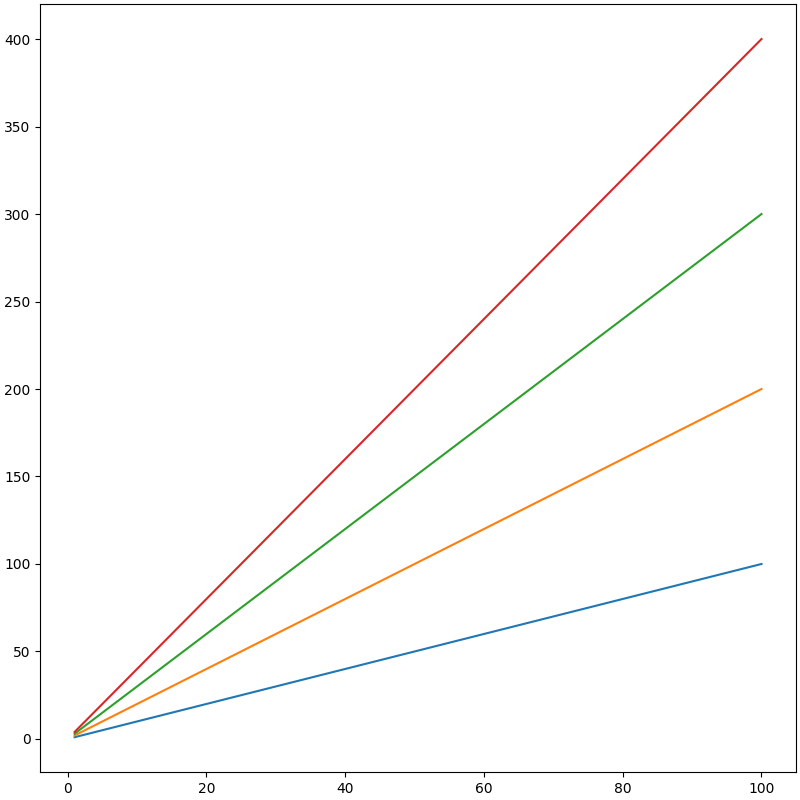
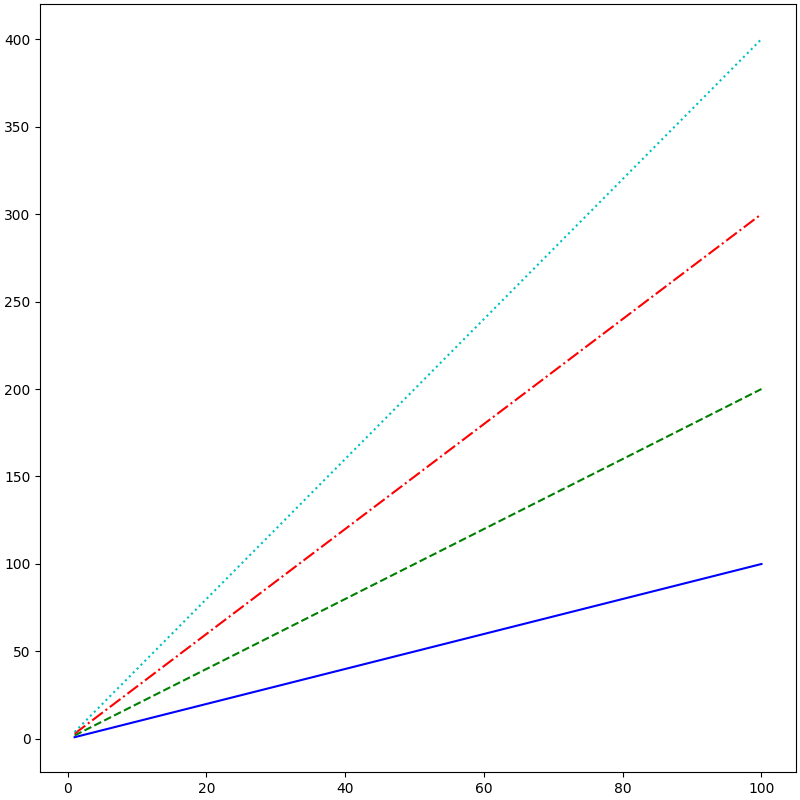
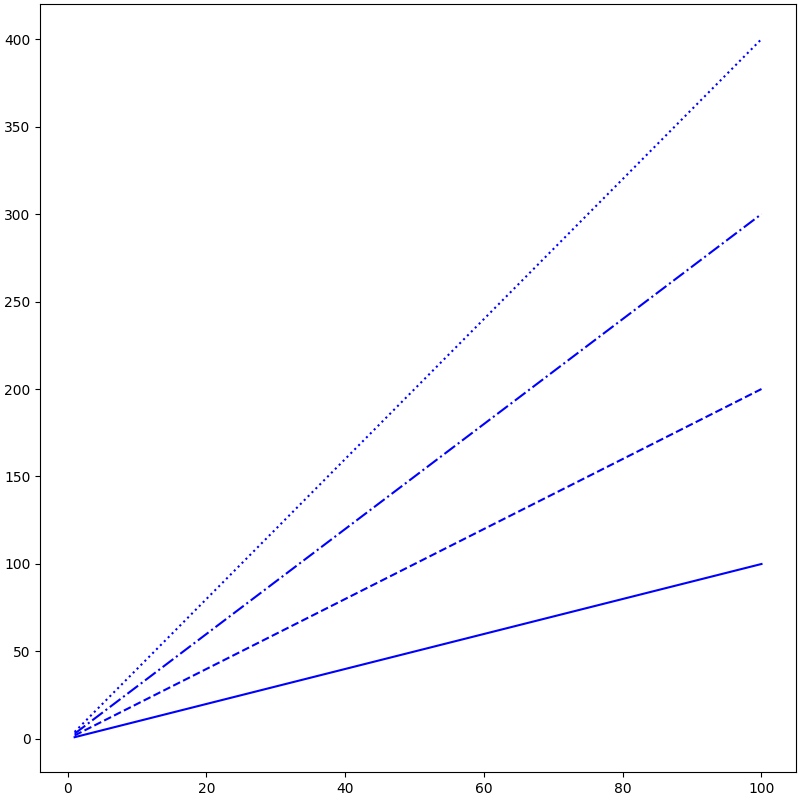
属性循环的应用
cycler.cycler — cycler 0.12.1 documentation
Styling with cycler — Matplotlib 3.10.1 documentation
自定义属性循环设置可以控制在一个Axes中多组绘图的颜色和其他样式属性。
-
mpl.rcParams["axes.prop_cycle"]=cycle:所有Axes -
Axes.set_prop_cycle(cycle):指定Axes

Seaborn
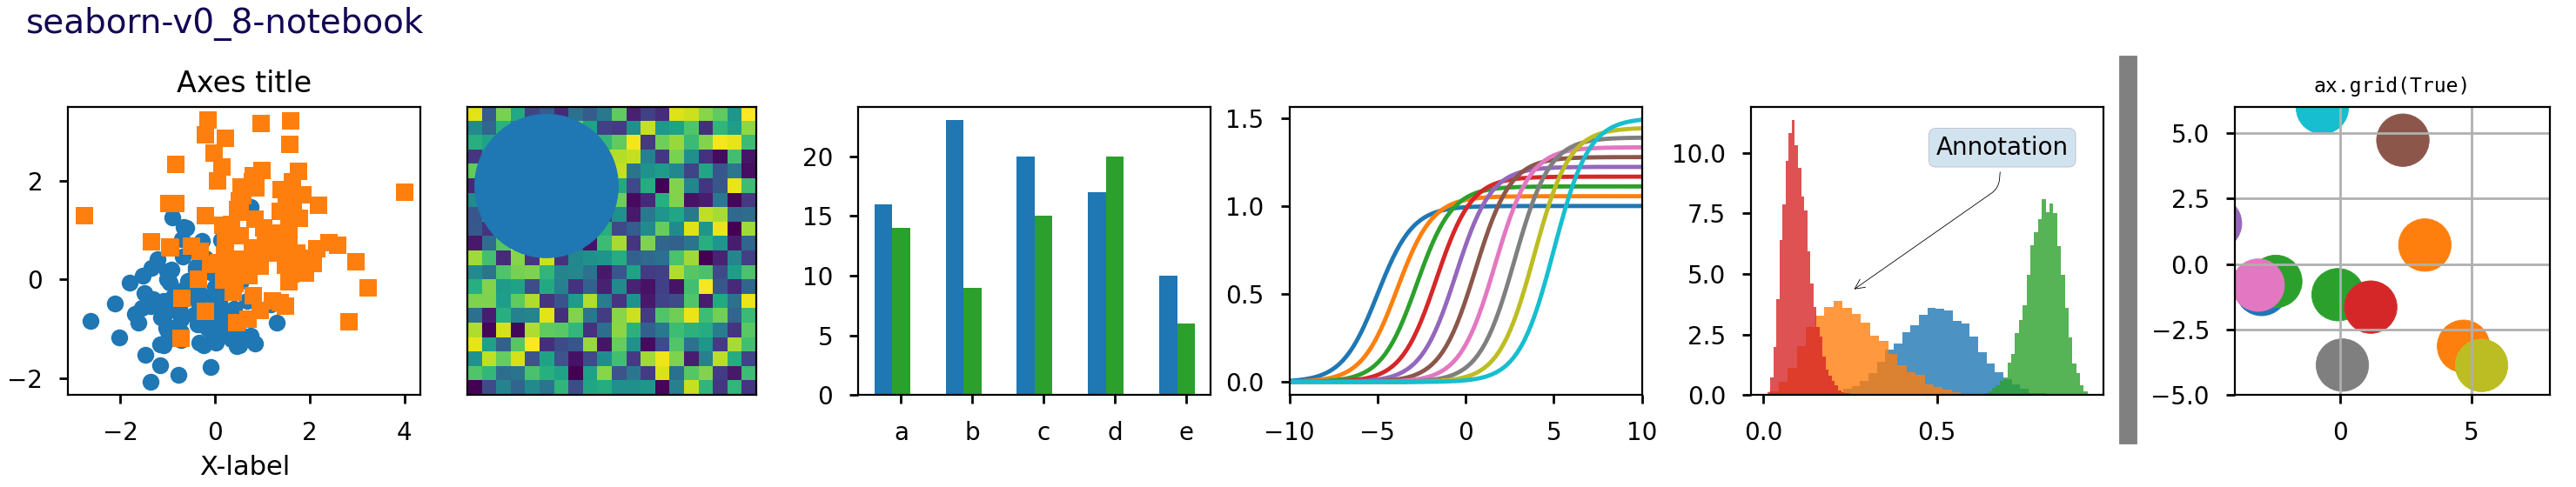
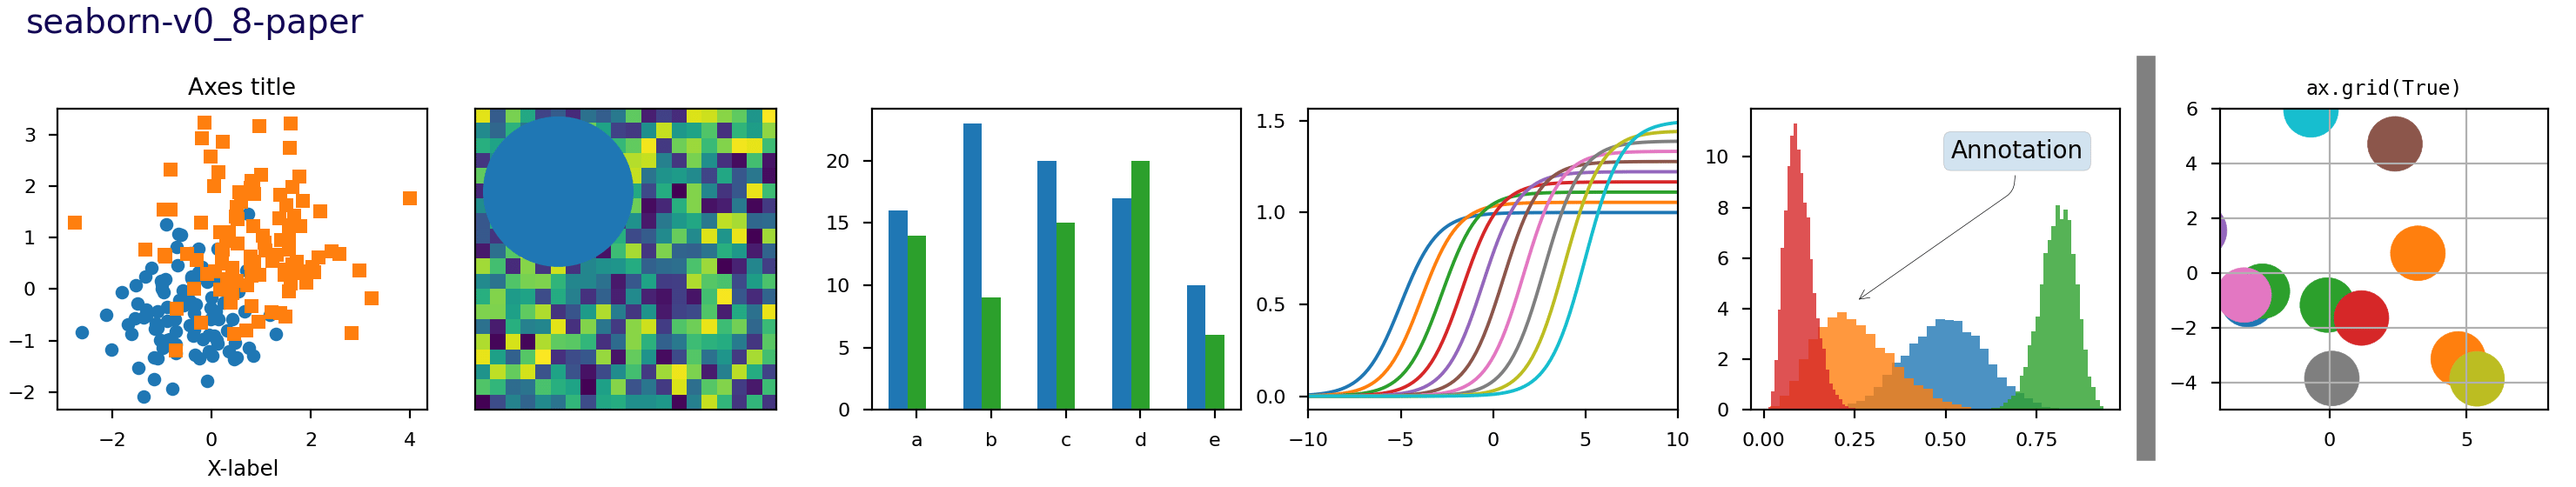
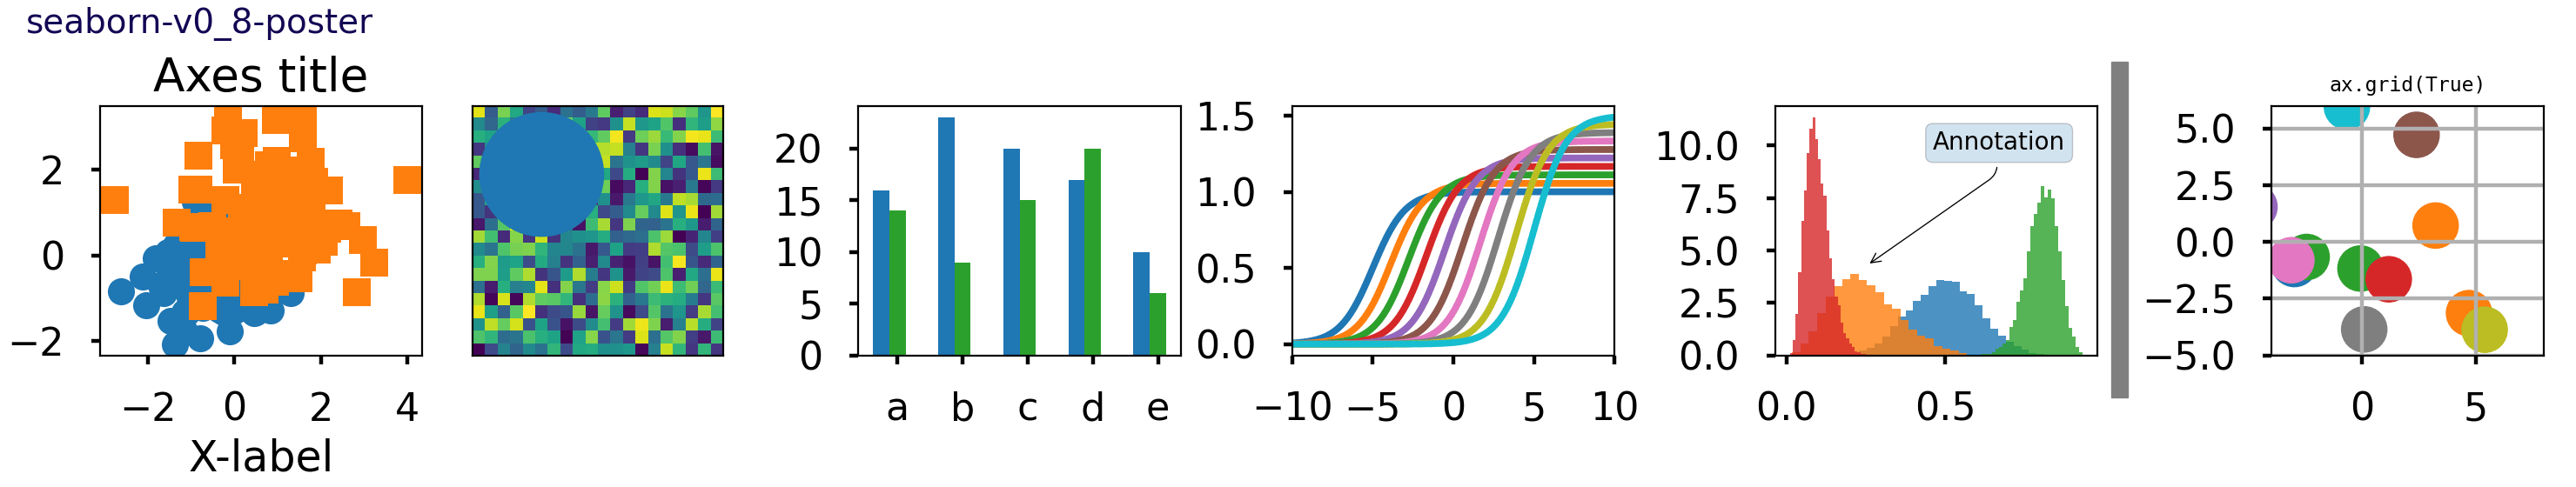
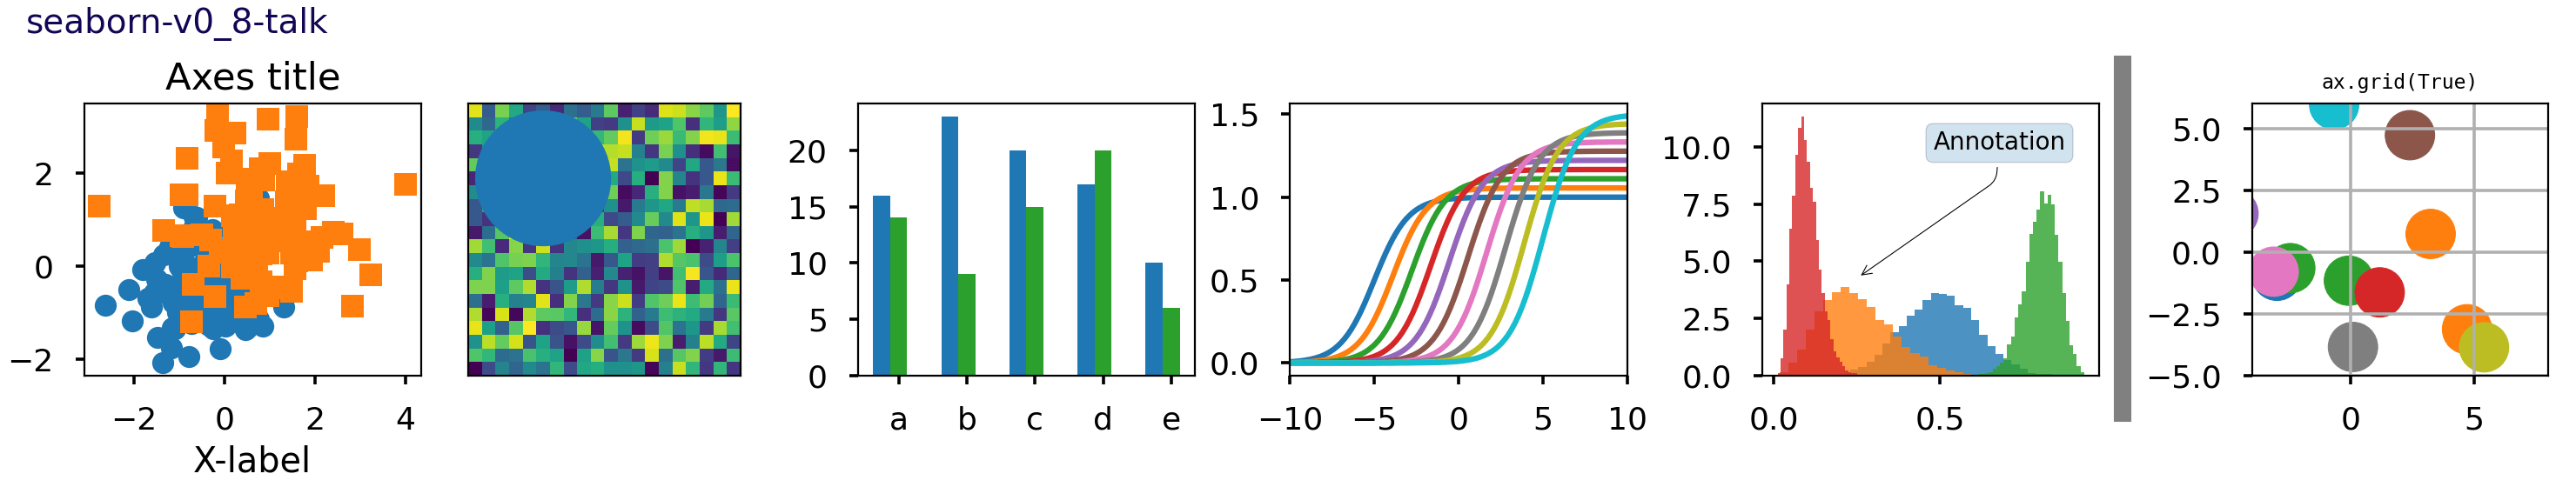
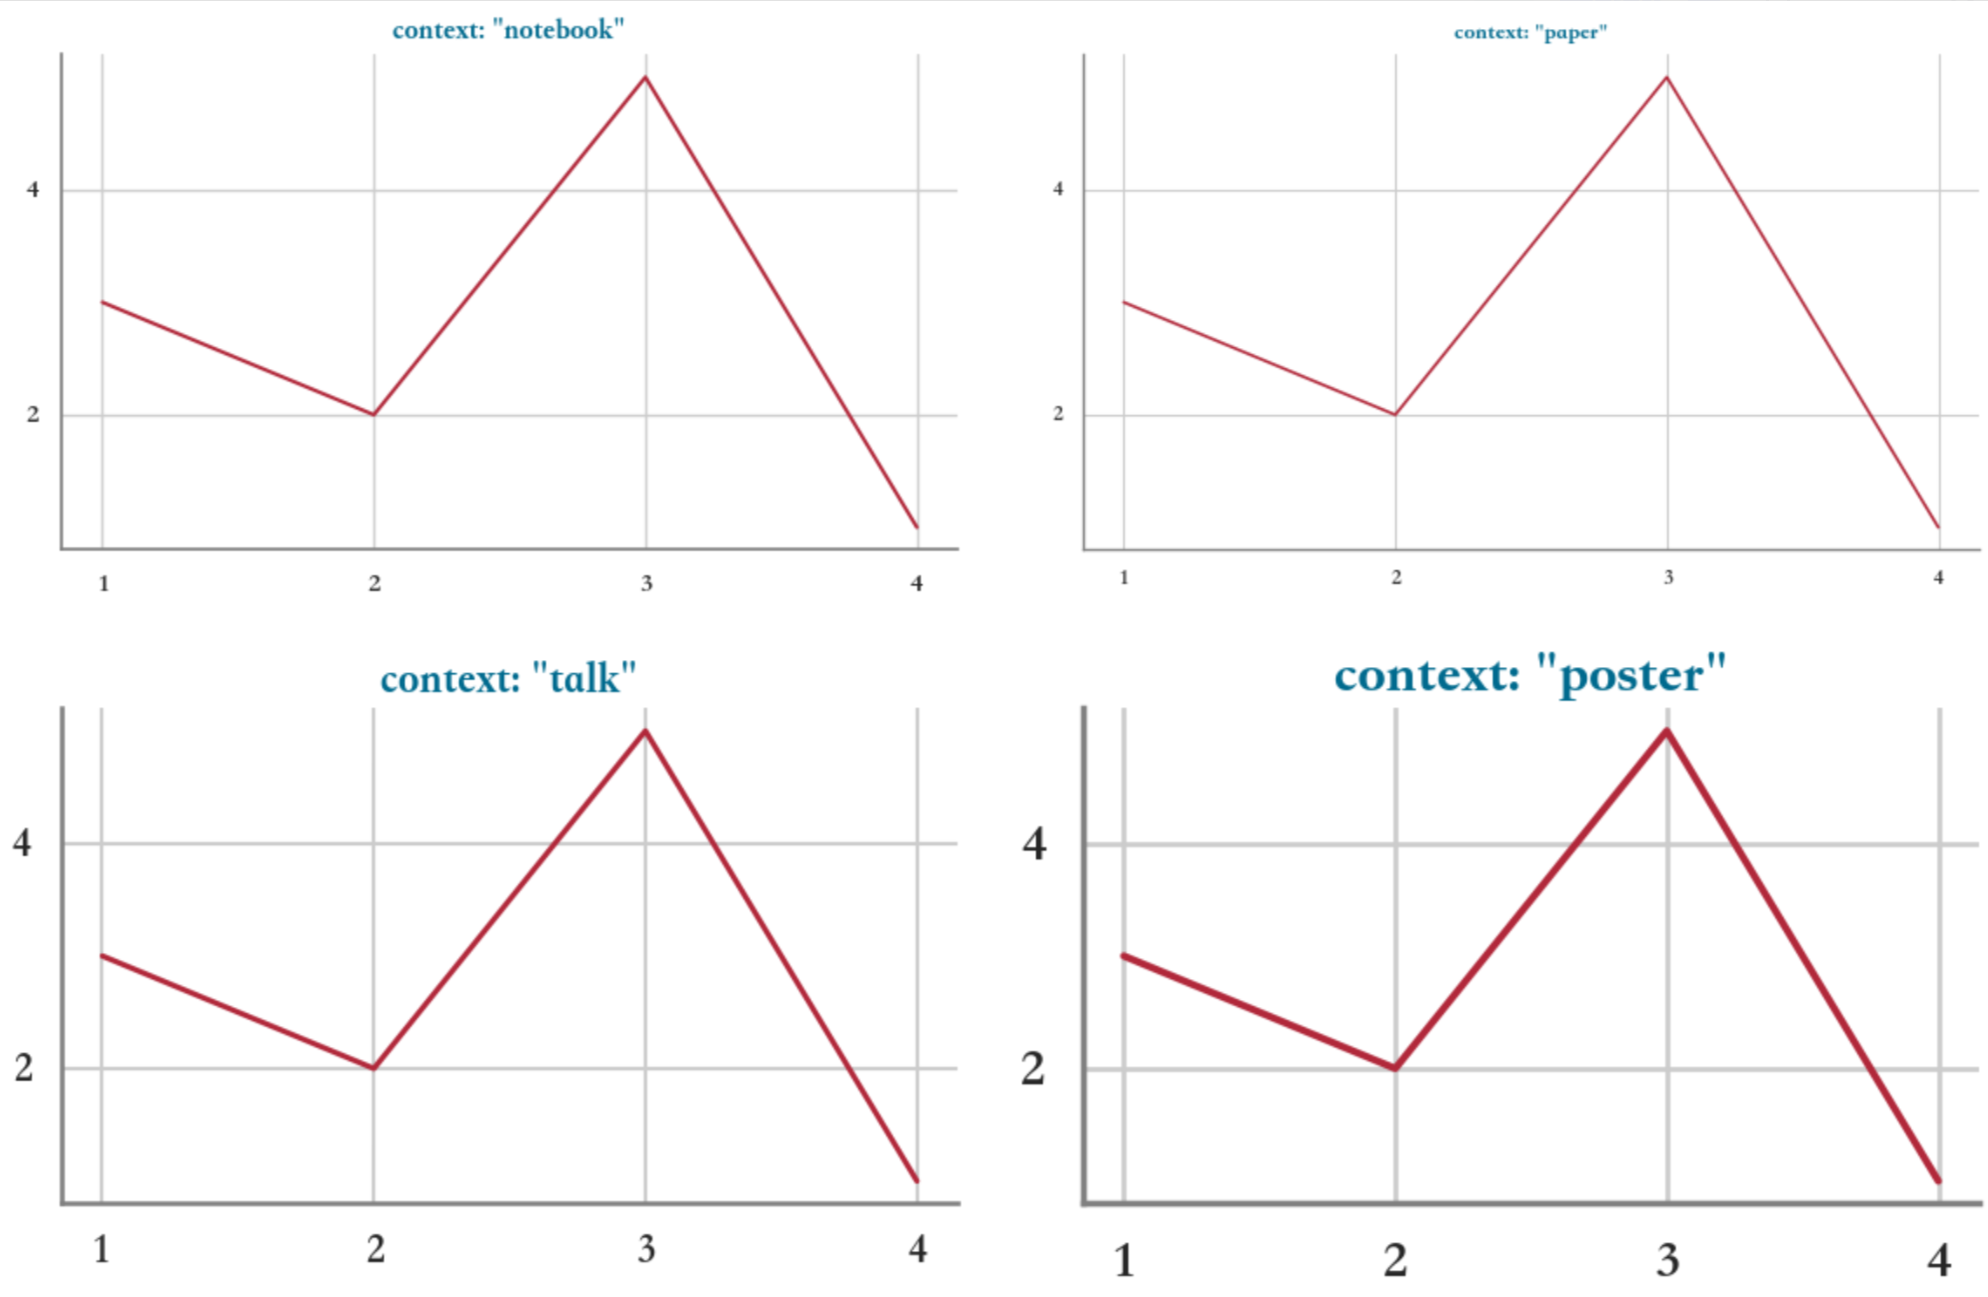
比例尺度(Context)
Controlling figure aesthetics — seaborn 0.13.2 documentation
seanborn内置了四套context设置,分别为 paper, notebook(默认), talk, poster。
plotting_context
seaborn.plotting_context — seaborn 0.13.2 documentation
sns.plotting_context(context=None, font_scale=1, rc=None)
获取context参数或上下文管理context参数。
-
context:自定义参数字典或预设配置集的名称。默认'notebook'。
-
font_scale:独立设置预设字体参数缩放。
-
rc:自定义参数字典,覆盖对应预设参数。
set_context
seaborn.set_context — seaborn 0.13.2 documentation
sns.set_context(context=None, font_scale=1, rc=None)
全局设置context。参数同上。
风格(Style)
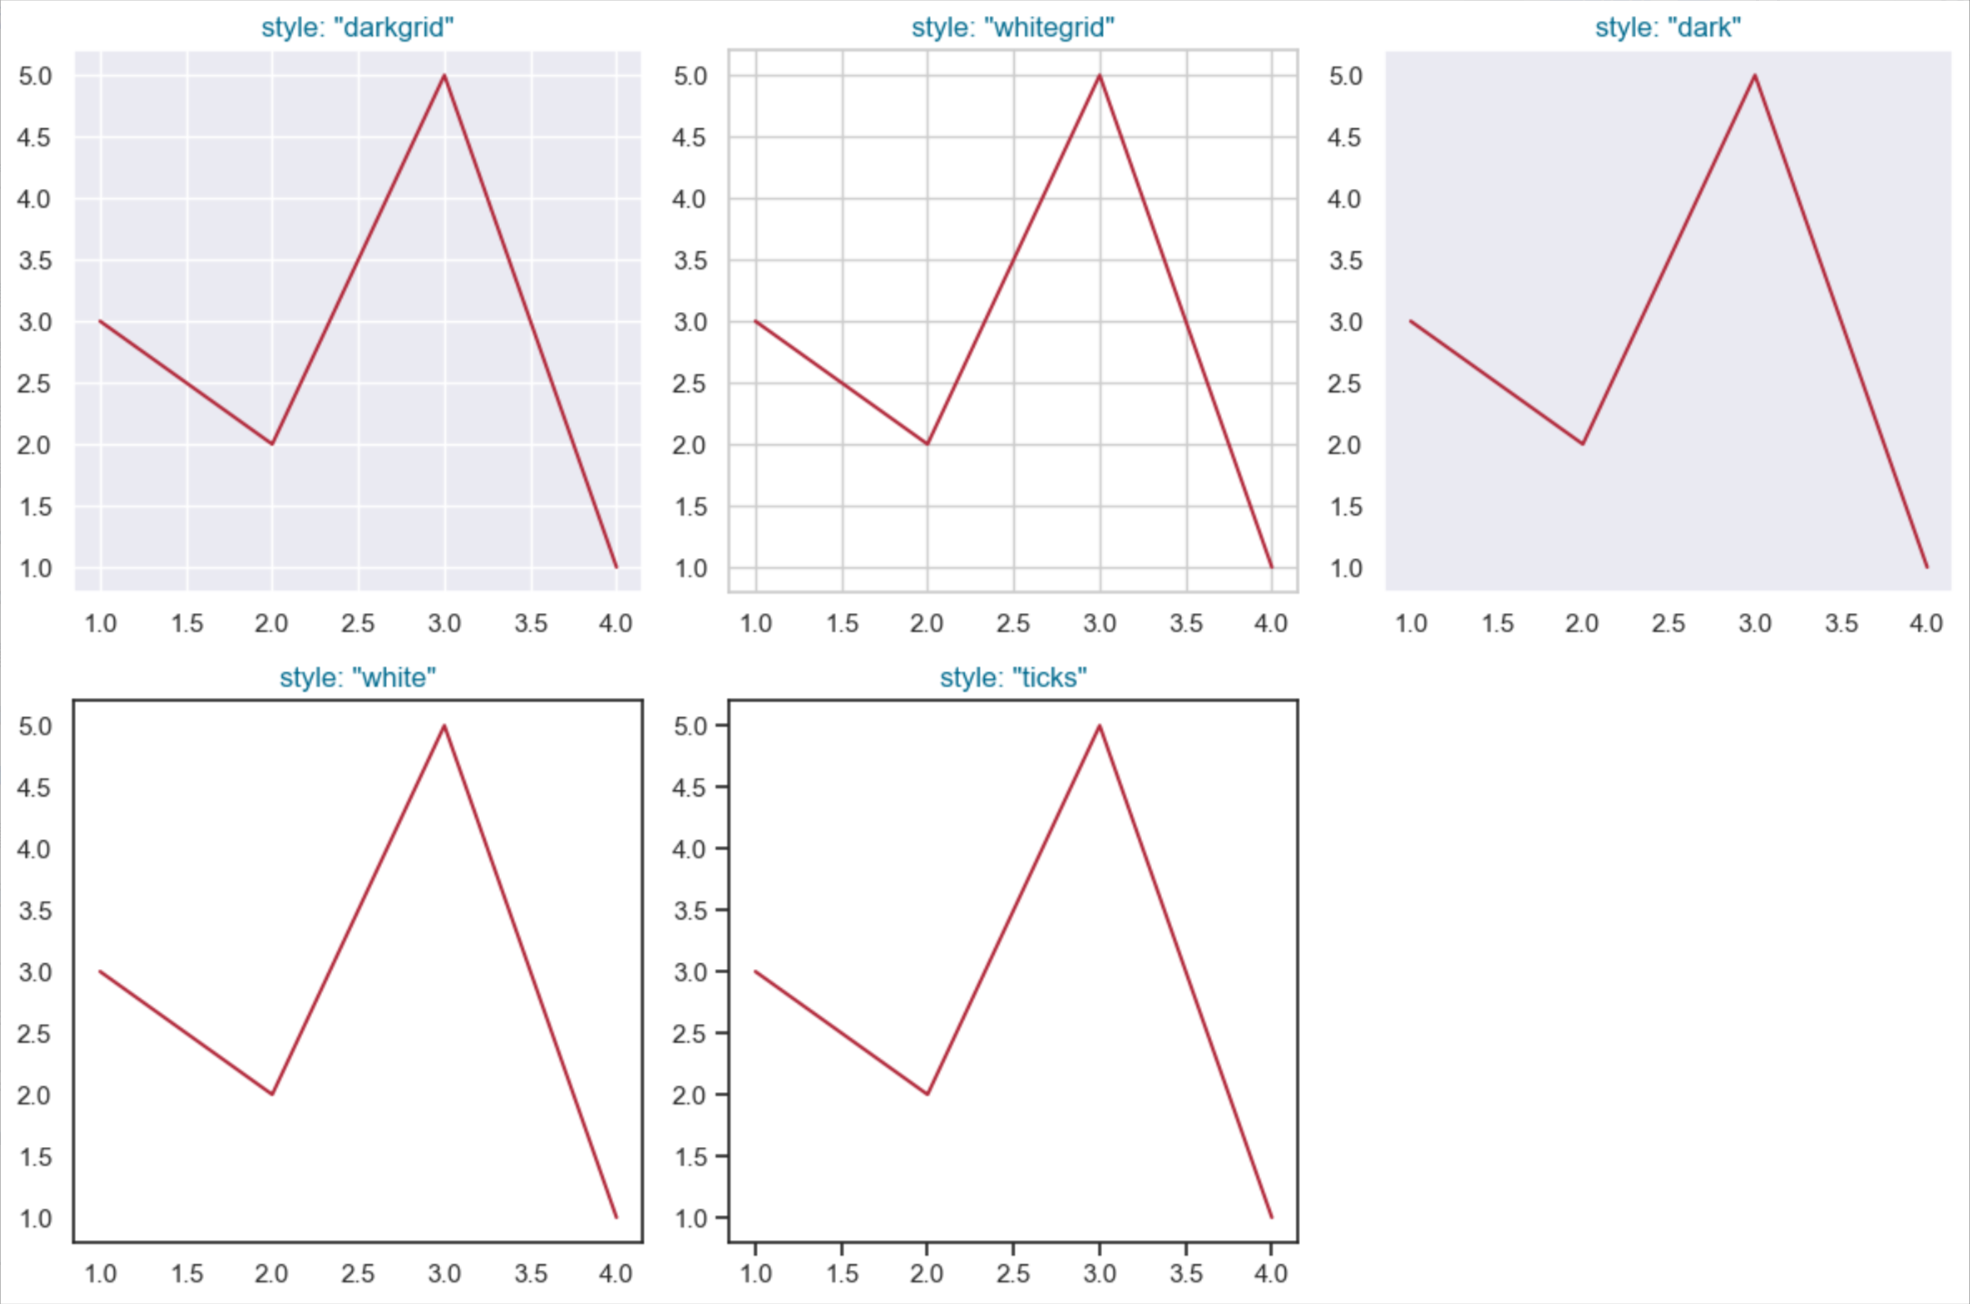
Controlling figure aesthetics — seaborn 0.13.2 documentation
seanborn内置了五套style设置,分别为 darkgrid(默认), whitegrid, dark, white, ticks。
axes_style
seaborn.axes_style — seaborn 0.13.2 documentation
Controlling figure aesthetics — seaborn 0.13.2 documentation
sns.axes_style(style=None, rc=None)
获取style参数或上下文管理style参数。
-
style:自定义参数字典或预设配置集的名称。默认'darkgrid'。
-
rc:自定义参数字典,覆盖对应预设参数。
| 参数获取 | |
|---|---|
1 2 3 4 5 6 7 8 9 10 11 12 13 14 15 16 17 18 19 20 21 22 23 24 25 26 27 28 29 30 31 32 33 34 35 36 37 38 39 40 41 42 43 44 45 46 47 48 49 50 51 52 53 54 55 56 57 58 59 60 61 62 63 64 65 66 67 68 69 70 71 72 73 74 75 76 77 78 79 80 81 82 83 84 85 86 87 88 89 90 91 92 93 94 95 96 97 98 99 100 101 102 103 104 105 106 107 108 109 | |
set_style
seaborn.set_style — seaborn 0.13.2 documentation
Controlling figure aesthetics — seaborn 0.13.2 documentation
sns.set_style(style=None, rc=None)
全局设置style。参数同上。
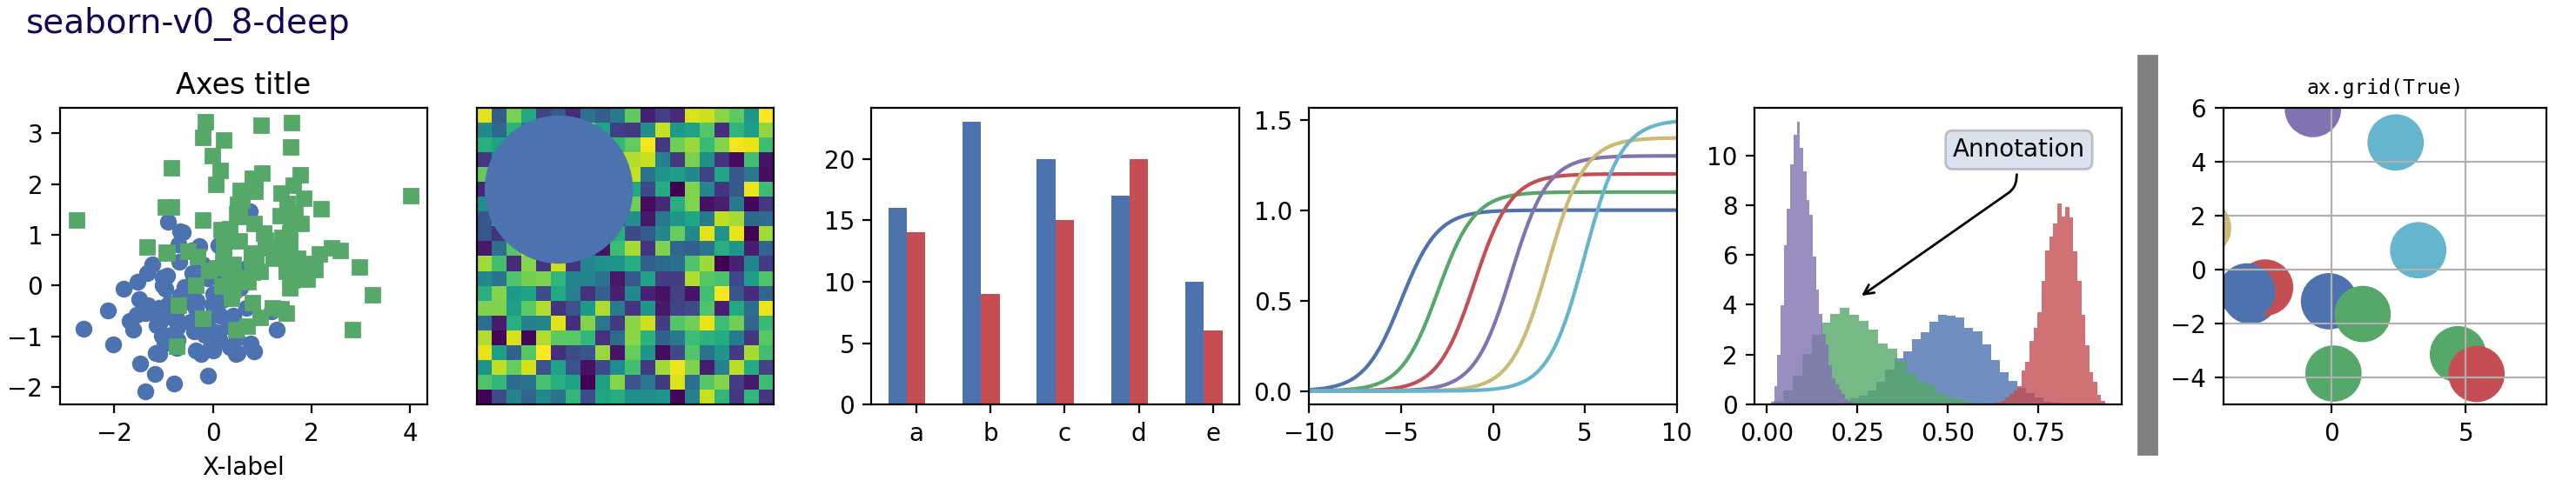
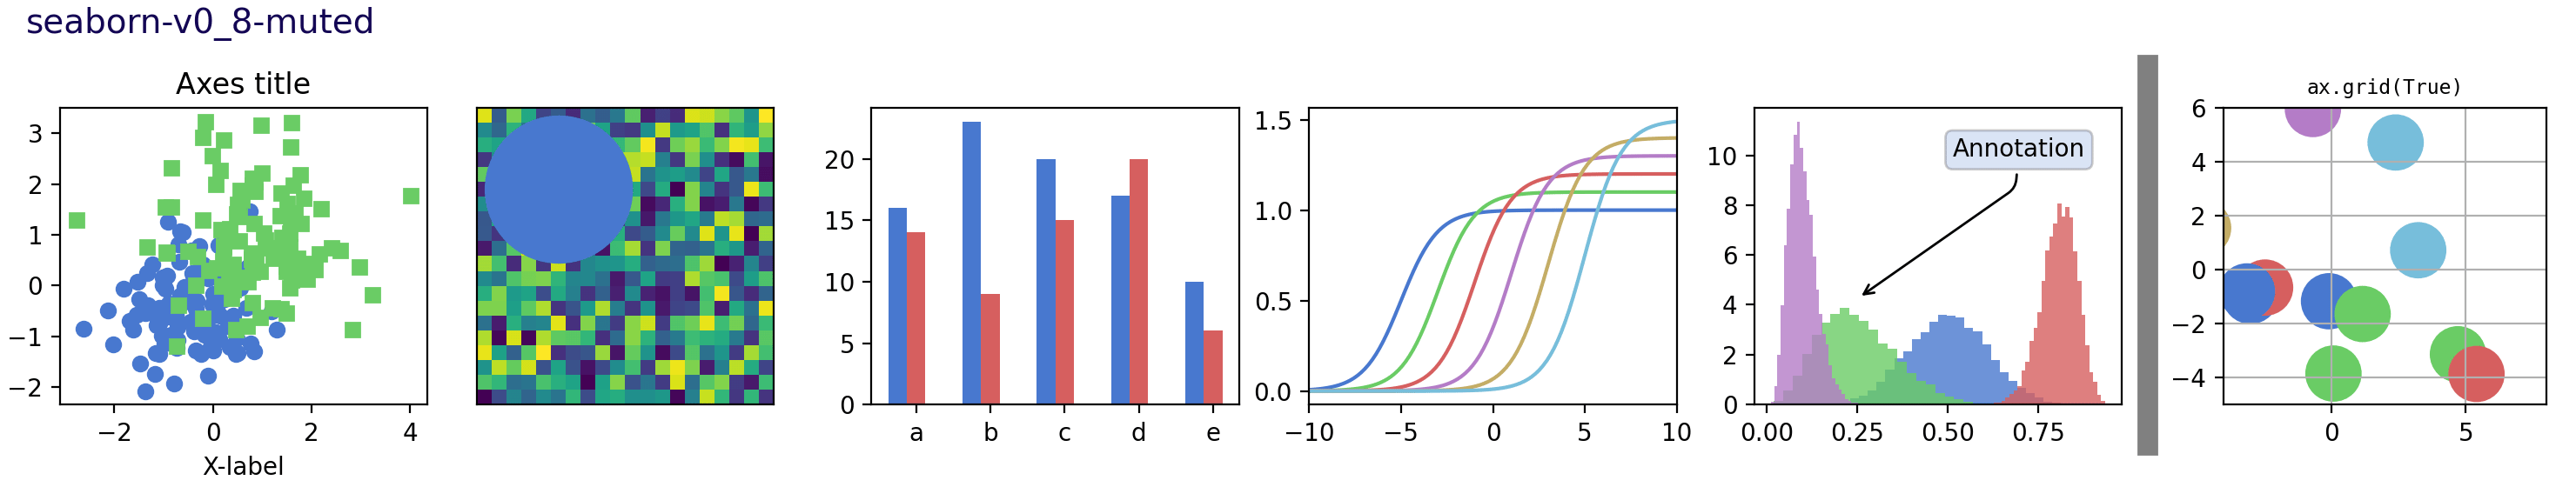
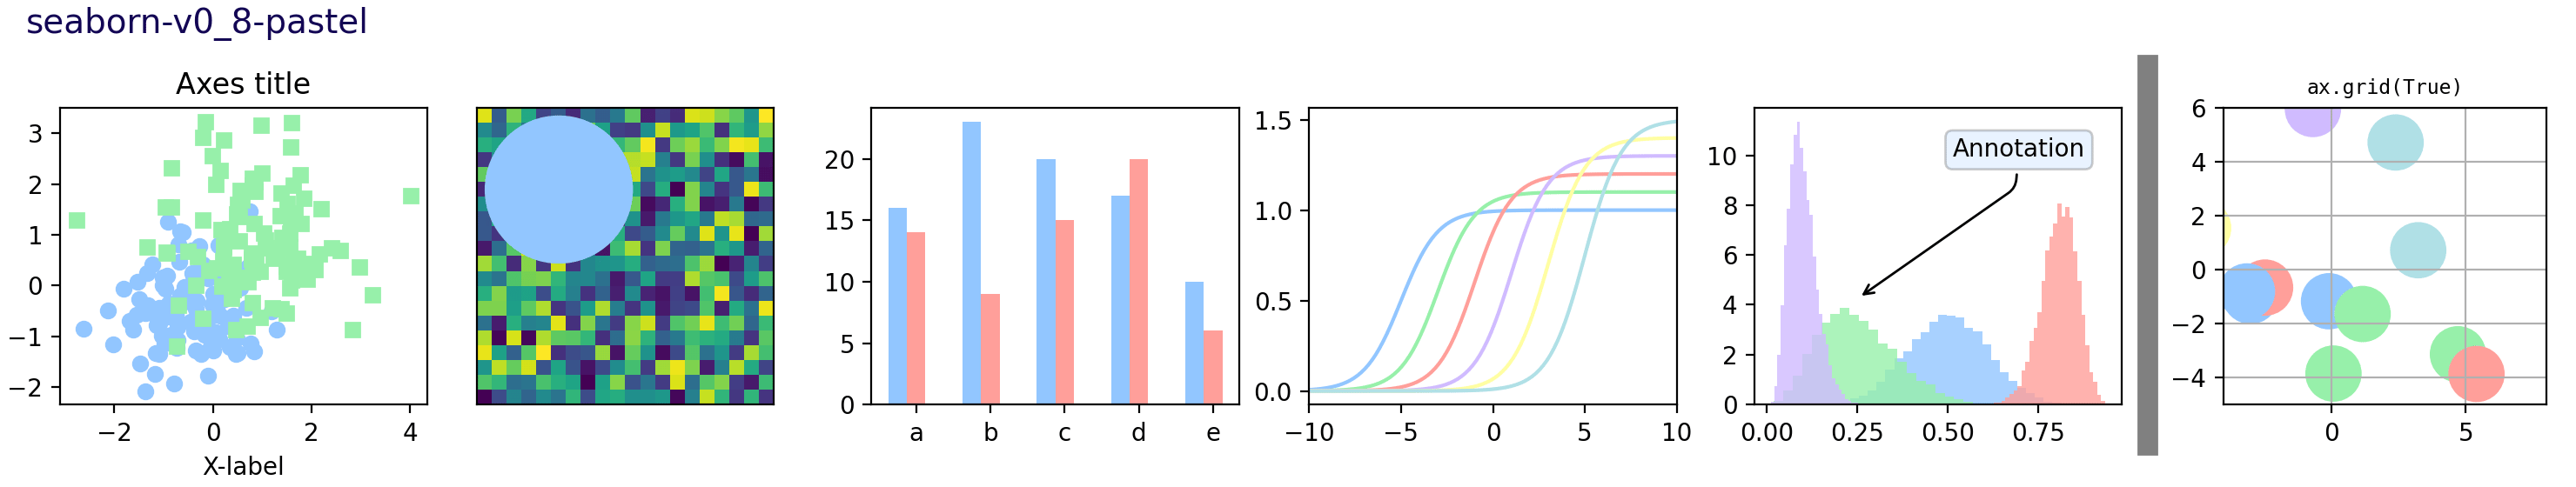
配色(Palettes)
Choosing color palettes — seaborn 0.13.2 documentation
color_palette
seaborn.color_palette — seaborn 0.13.2 documentation
sns.color_palette(palette=None, n_colors=None, desat=None, as_cmap=False)
查看或构建调色板,返回一个颜色列表或Colormap对象。同样可进行上下文管理,针对默认颜色循环。该函数被任何具有 palette 参数的函数内部使用。
-
palette:
-
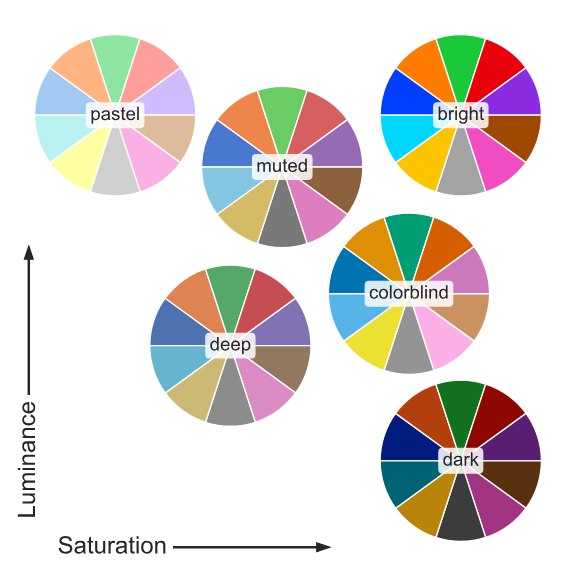
seaborn内置palette:
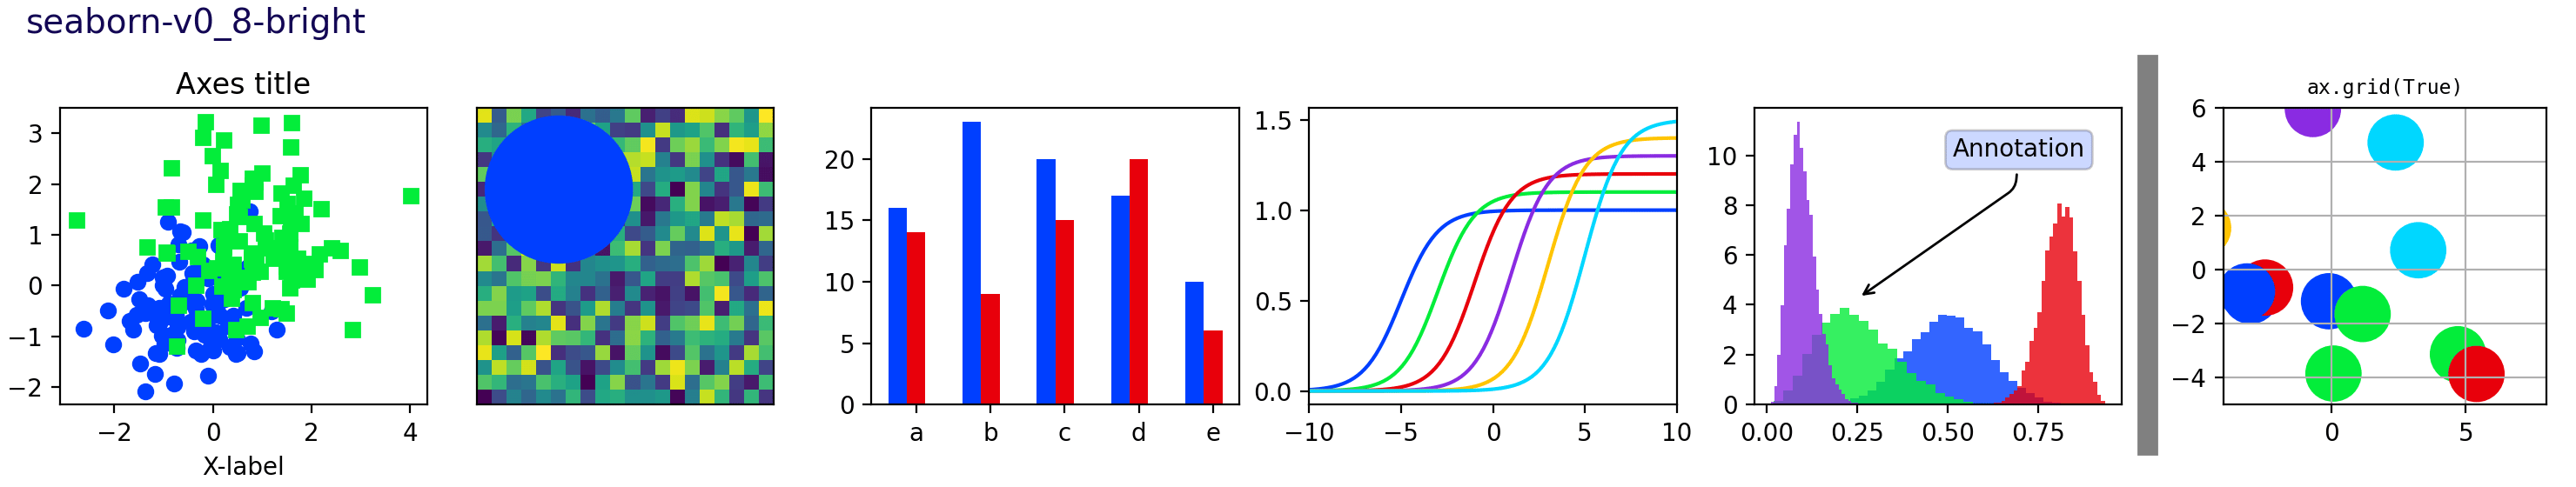
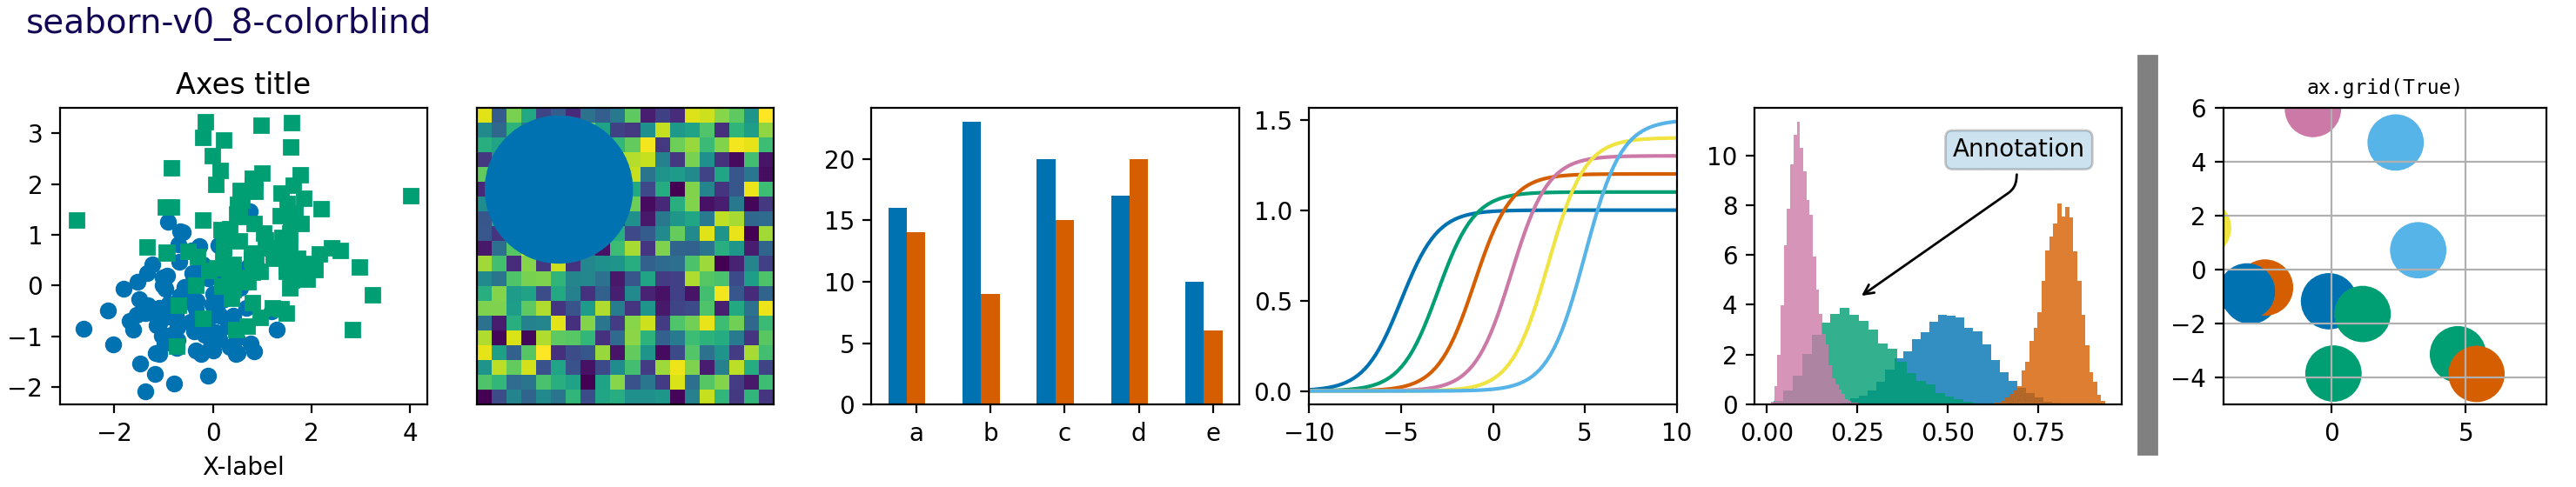
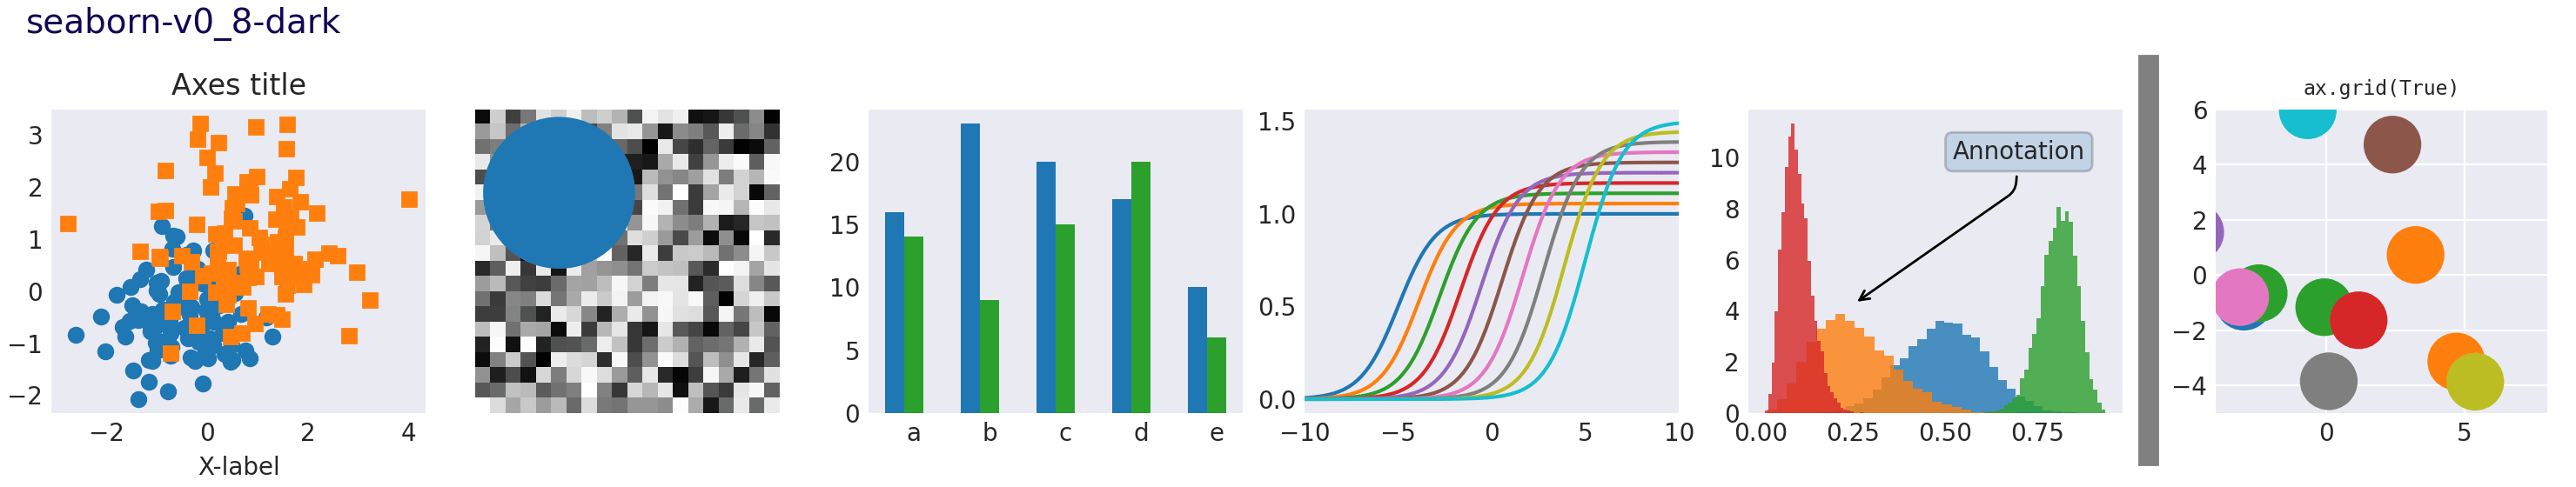
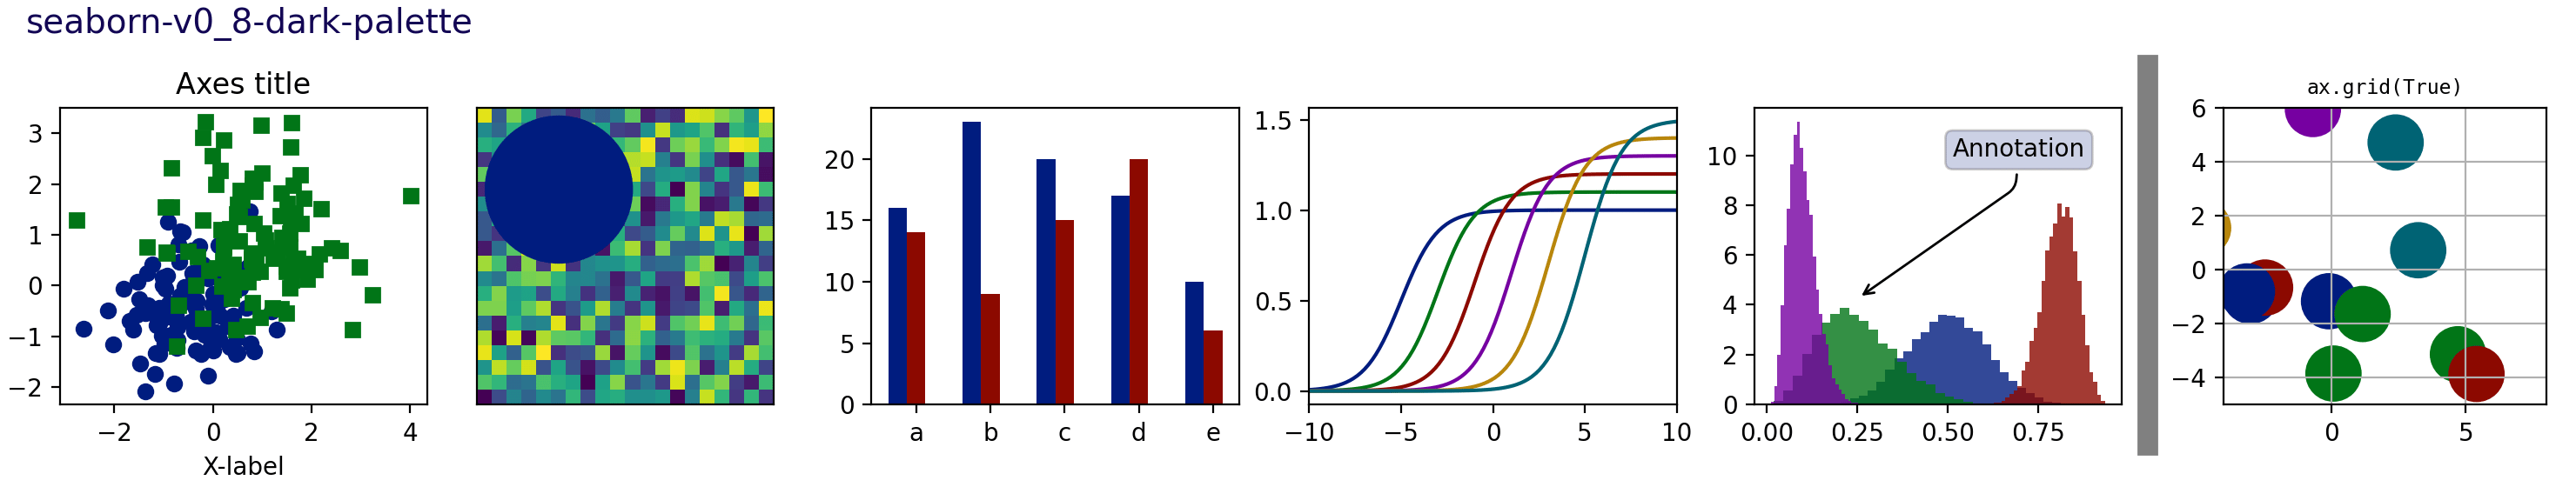
'deep', 'muted', 'bright', 'pastel', dark', 'colorblind', "rocket" , "mako" , "flare", "crest", "vlag", "icefire"
-
matplotlib内置colormap
-
'husl' 或 'hls':
当有任意数量的类别时,找到独特色调的最简单方法是在圆形色空间中绘制均匀分布的颜色(在这种色空间中,色调变化,同时保持亮度和饱和度不变)
-
'ch: <cubehelix arguments> [_r]'
-
'light:<color>[_r]', 'dark:<color>[_r]', 'blend:<color>,<color>,...'
-
颜色序列
-
None:返回当前的 matplotlib 颜色循环
-
-
n_colors:颜色数。默认为6。大于调色板自身颜色数量时将产生循环。as_cmap为 True时将被忽略。
-
desat:每种颜色的去饱和比例
-
as_cmap:True返回Colormap对象;False返回RGB元组列表
set_palette
seaborn.set_palette — seaborn 0.13.2 documentation
全局设置默认颜色循环
sns.set_palette(palette, n_colors=None, desat=None, color_codes=False)
-
palette、n_colors、desat:同上
-
color_codes:如果为
True且palette 是 seaborn内置palette,则将简写颜色代码(例如'b','g','r'等)重新映射到此调色板中的颜色。如下。
set_color_codes
seaborn.set_color_codes — seaborn 0.13.2 documentation
更改matplotlib颜色缩写的解释方式。调用此方法将改变后续图表中对简写代码(如'b'或'g'等)的解析方式。
sns.set_color_codes(palette='deep')
palette参数可选seaborn内置palette(如下图)。
主题(theme)
seaborn.set_theme — seaborn 0.13.2 documentation
综合设置绘图参数。将影响所有 matplotlib 图表,包括那些未使用 seaborn 制作的图表。
| set_theme | |
|---|---|
恢复设置
seaborn.reset_defaults — seaborn 0.13.2 documentation
seaborn.reset_orig — seaborn 0.13.2 documentation
-
sns.reset_defaults() -
sns.reset_orig()