线(Line)与标记(Marker)
matplotlib.lines.Line2D — Matplotlib 3.10.1 documentation
| 导入模块与数据准备 |
|---|
| import matplotlib as mpl
import matplotlib.pyplot as plt
import numpy as np
x = np.arange(1, 51, 1)
"""
[ 1 2 3 4 5 6 7 8 9 10 11 12 13 14 15 16 17 18 19 20 21 22 23 24 25 26 27 28 29 30 31 32 33 34 35 36 37 38 39 40 41 42 43 44 45 46 47 48 49 50]
"""
y = np.sin(x)
"""
[ 0.84147098 0.90929743 0.14112001 -0.7568025 -0.95892427 -0.2794155 0.6569866 0.98935825 0.41211849 -0.54402111 -0.99999021 -0.53657292 0.42016704 0.99060736 0.65028784 -0.28790332 -0.96139749 -0.75098725 0.14987721 0.91294525 0.83665564 -0.00885131 -0.8462204 -0.90557836 -0.13235175 0.76255845 0.95637593 0.27090579 -0.66363388 -0.98803162 -0.40403765 0.55142668 0.99991186 0.52908269 -0.42818267 -0.99177885 -0.64353813 0.29636858 0.96379539 0.74511316 -0.15862267 -0.91652155 -0.83177474 0.01770193 0.85090352 0.90178835 0.12357312 -0.76825466 -0.95375265 -0.26237485]
"""
|
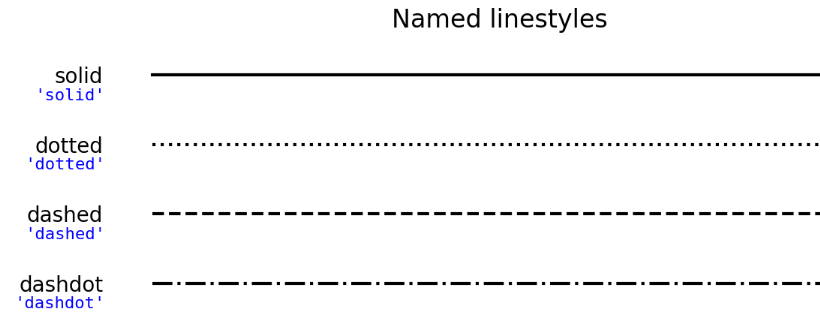
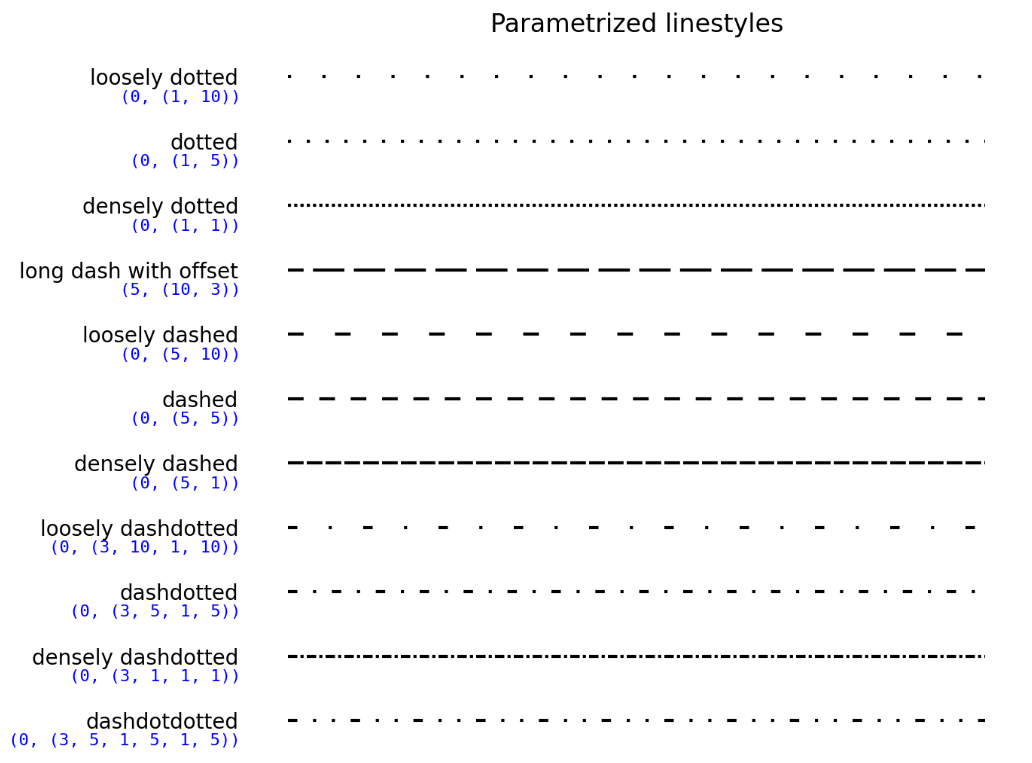
线型(Line Style)
Linestyles — Matplotlib 3.10.1 documentation
字符串型
linestyle=""
| 字符串型 |
|---|
| from matplotlib.lines import Line2D
Line2D.lineStyles
"""
{'-': '_draw_solid', '--': '_draw_dashed', '-.': '_draw_dash_dot', ':': '_draw_dotted',
'None': '_draw_nothing', ' ': '_draw_nothing', '': '_draw_nothing'}
"""
|
| 字符串 |
含义 |
|
| "solid" / "-" |
实线(——) |
|
| "dotted" / ":" |
点线(·········) |
rcParams["lines.dotted_pattern"]=[1.0, 1.65] |
| "dashed" / "--" |
虚线(-----) |
rcParams["lines.dashed_pattern"]=[3.7, 1.6] |
| "dashdot" / "-." |
点划线(·-·-·-·) |
rcParams["lines.dashdot_pattern"]=[6.4, 1.6, 1.0, 1.6] |
| 常规 |
|---|
| fig = plt.figure(figsize=(8, 8), dpi=100, layout="constrained")
ax = fig.add_subplot(1, 1, 1)
ax.plot(x, y,
linestyle="dashdot", # (1)!
linewidth=4, # (2)!
color="green", # (3)!
gapcolor="red", # (4)!
alpha=0.5 # (5)!
)
plt.show()
|
- 线型(linestyle/ls)
- 线宽(linewidth/lw)
- 可见线段填充色(color/c)
- 不可见线段填充色
- 透明度
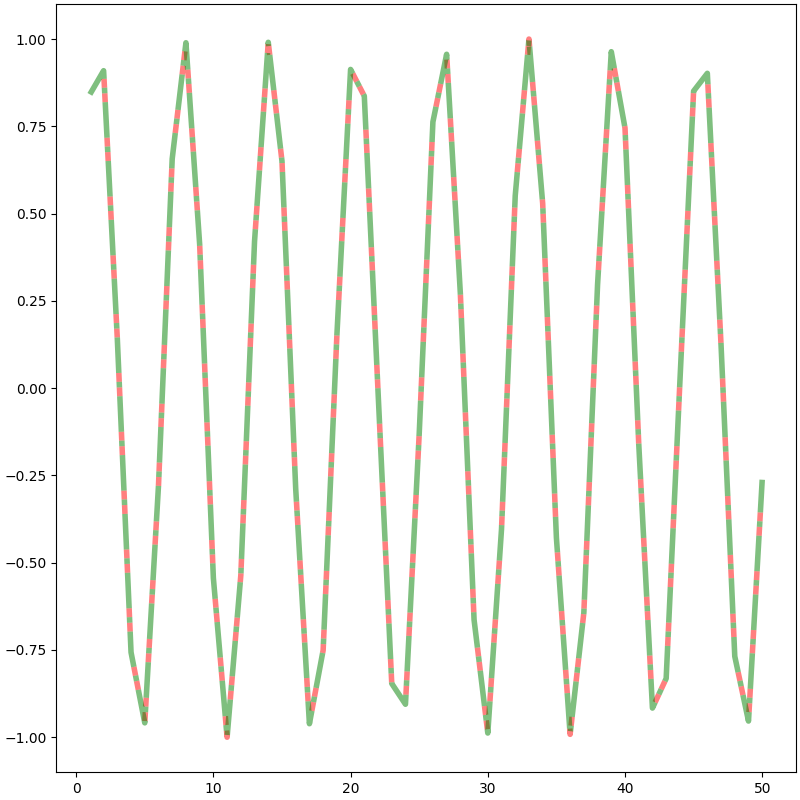
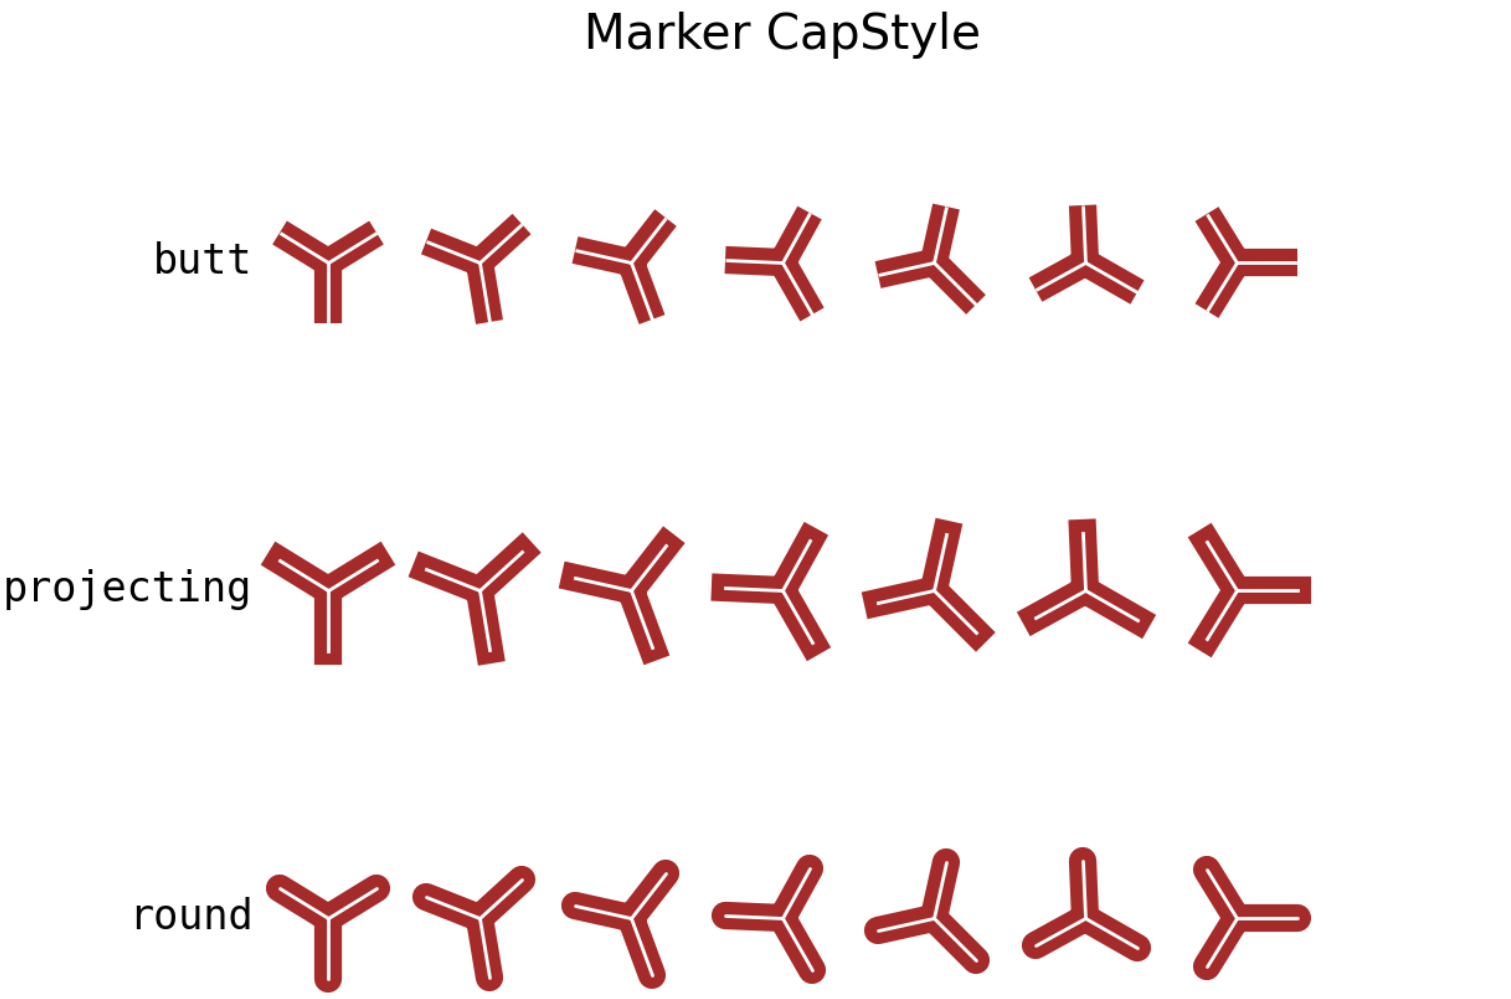
| linestyle='solid' |
|---|
| fig = plt.figure(figsize=(8, 8), dpi=100, layout="constrained")
ax = fig.add_subplot(1, 1, 1)
ax.plot(x, y,
linestyle="solid",
linewidth=10,
color="green",
gapcolor="red",
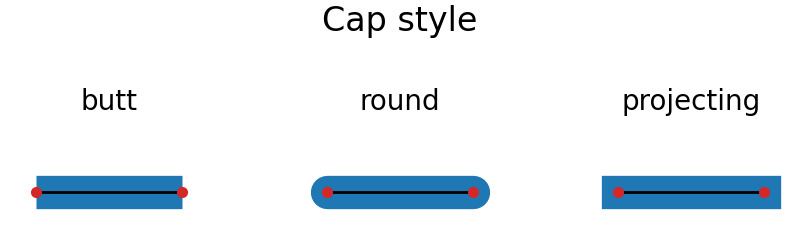
solid_capstyle="butt", # (1)!
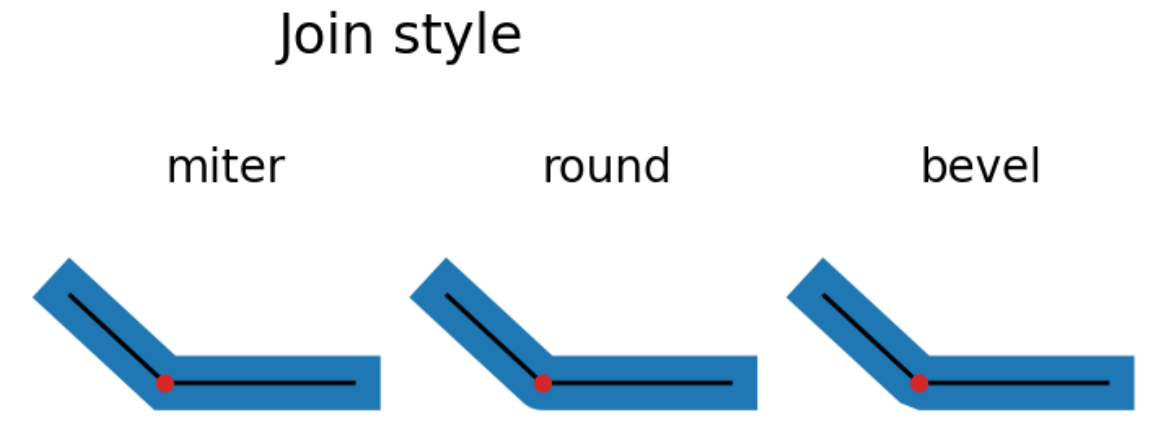
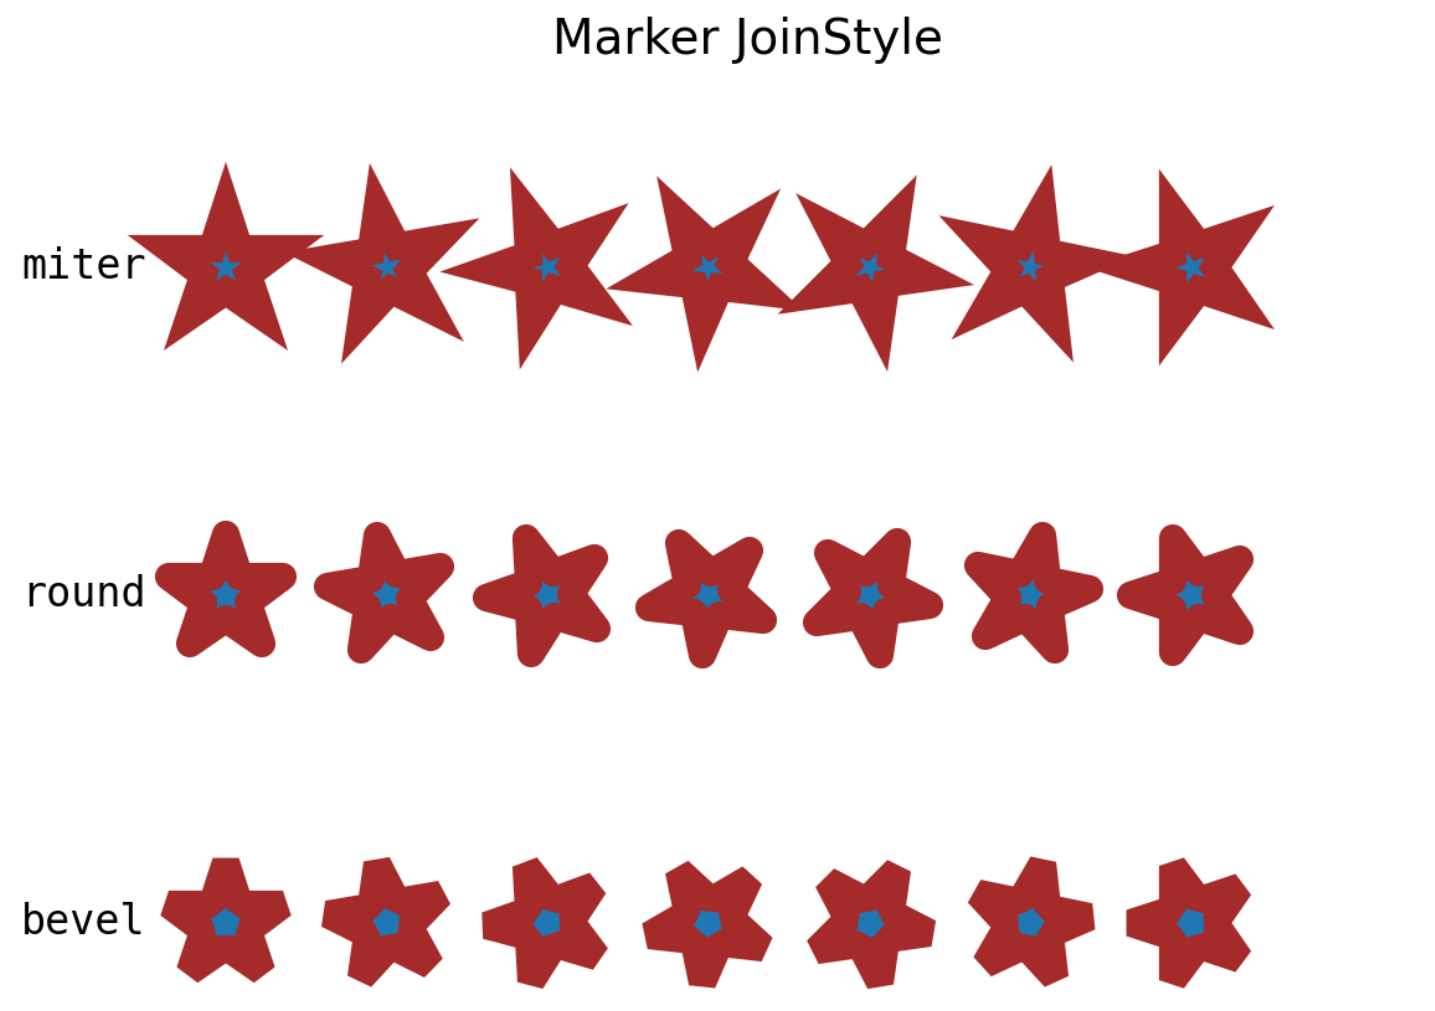
solid_joinstyle="miter", # (2)!
alpha=0.5
)
plt.show()
|
- 当linestyle="solid"时,两个端点的样式
- 当linestyle="solid"时,连接点(转折点)的样式
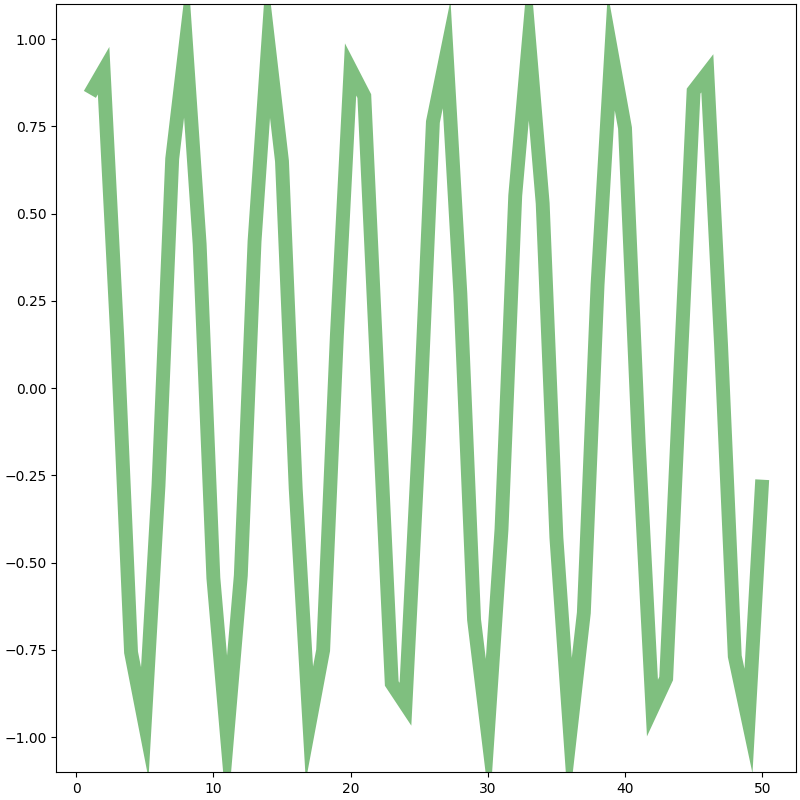
| linestyle≠'solid' |
|---|
| fig = plt.figure(figsize=(8, 8), dpi=100, layout="constrained")
ax = fig.add_subplot(1, 1, 1)
ax.plot(x, y,
linestyle="dashdot",
linewidth=10,
color="green",
gapcolor="red",
dash_capstyle="round", # (1)!
dash_joinstyle="miter", # (2)!
alpha=0.5
)
plt.show()
|
- 当linestyle≠"solid"时,每个线段端点的样式
- 当linestyle≠"solid"时,每个线段连接点(转折点)的样式
元组型
linestyle=(offset, on_off_seq)
-
offset:在构建的线型上开始的偏移量(以点为单位)
-
on_off_seq:通过序列构建线型。若序列长度为偶数,则偶数位(0开始)代表可见线段长度(以点为单位),奇数位表示不可见线段的长度(以点为单位);若序列长度为奇数,则序列扩增为2倍【即(3, 1, 1) 相当于 (3, 1, 1, 3, 1, 1)】
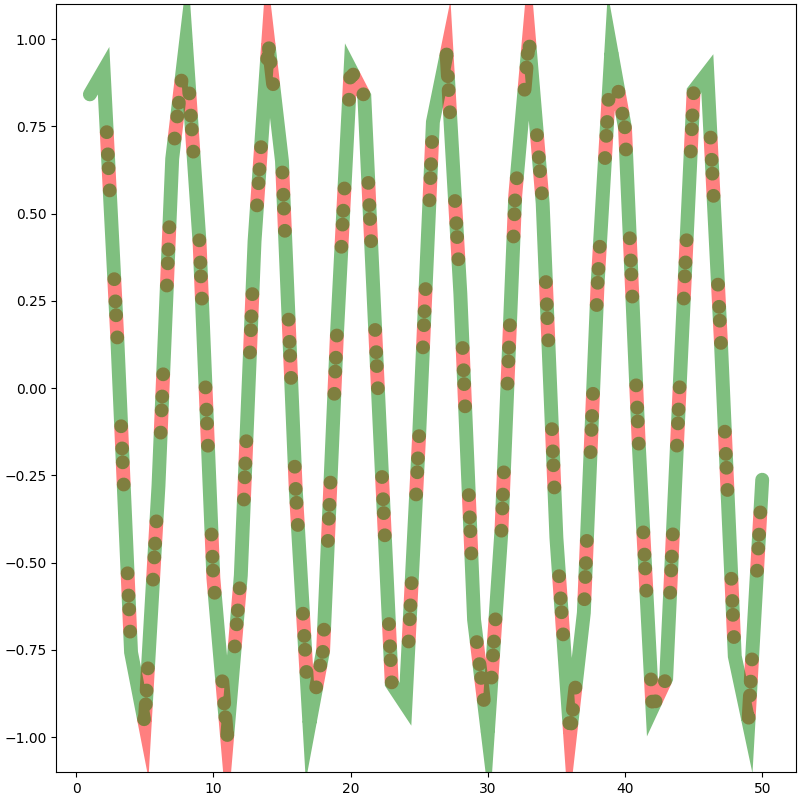
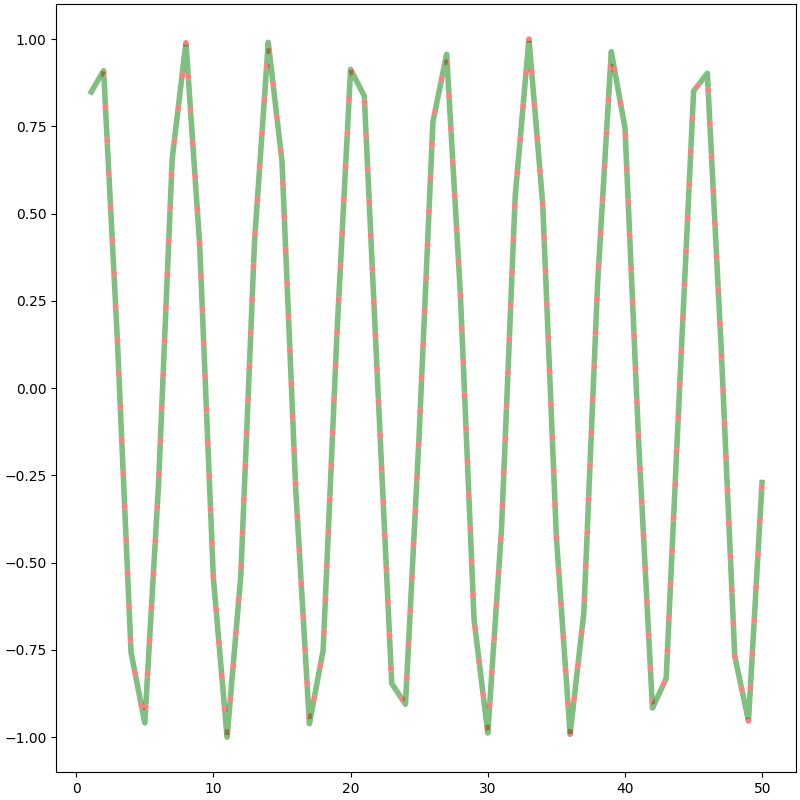
| linestyle=(offset, on_off_seq) |
|---|
| fig = plt.figure(figsize=(8, 8), dpi=100, layout="constrained")
ax = fig.add_subplot(1, 1, 1)
# 构建5可见1不可见的线型,第一段偏移量为4,所以第一段仅为1可见1不可见
ax.plot(x, y,
linestyle=(4, (5, 1)),
linewidth=4,
color="green",
gapcolor="red",
alpha=0.5
)
plt.show()
|
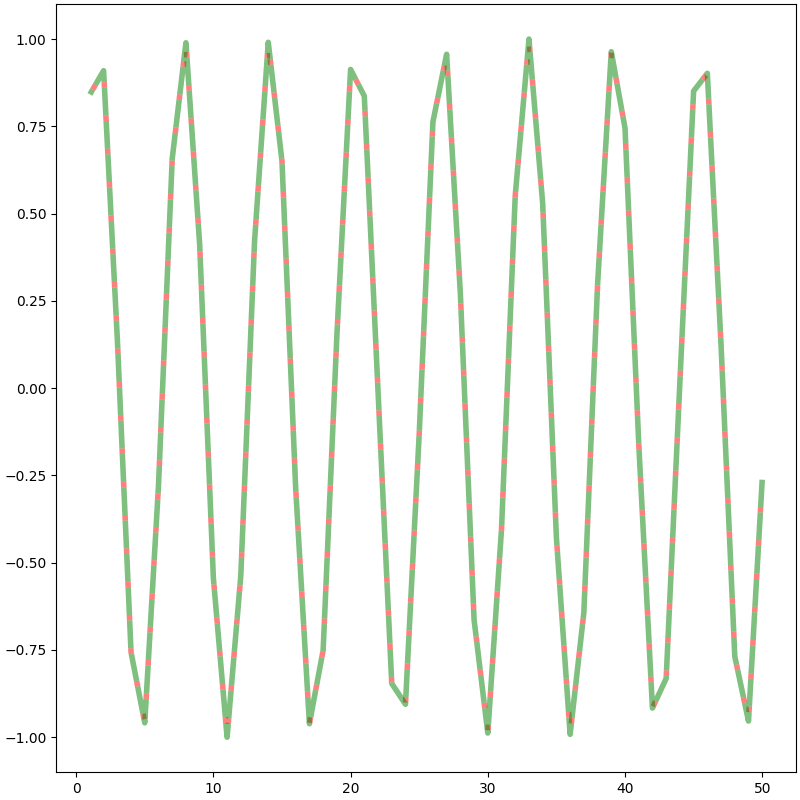
dashes=(on_off_seq)
| dashes=(on_off_seq) |
|---|
| fig = plt.figure(figsize=(8, 8), dpi=100, layout="constrained")
ax = fig.add_subplot(1, 1, 1)
# 构建5可见1不可见的线型
ax.plot(x, y,
dashes=(5, 1),
linewidth=4,
color="green",
gapcolor="red",
alpha=0.5
)
plt.show()
|
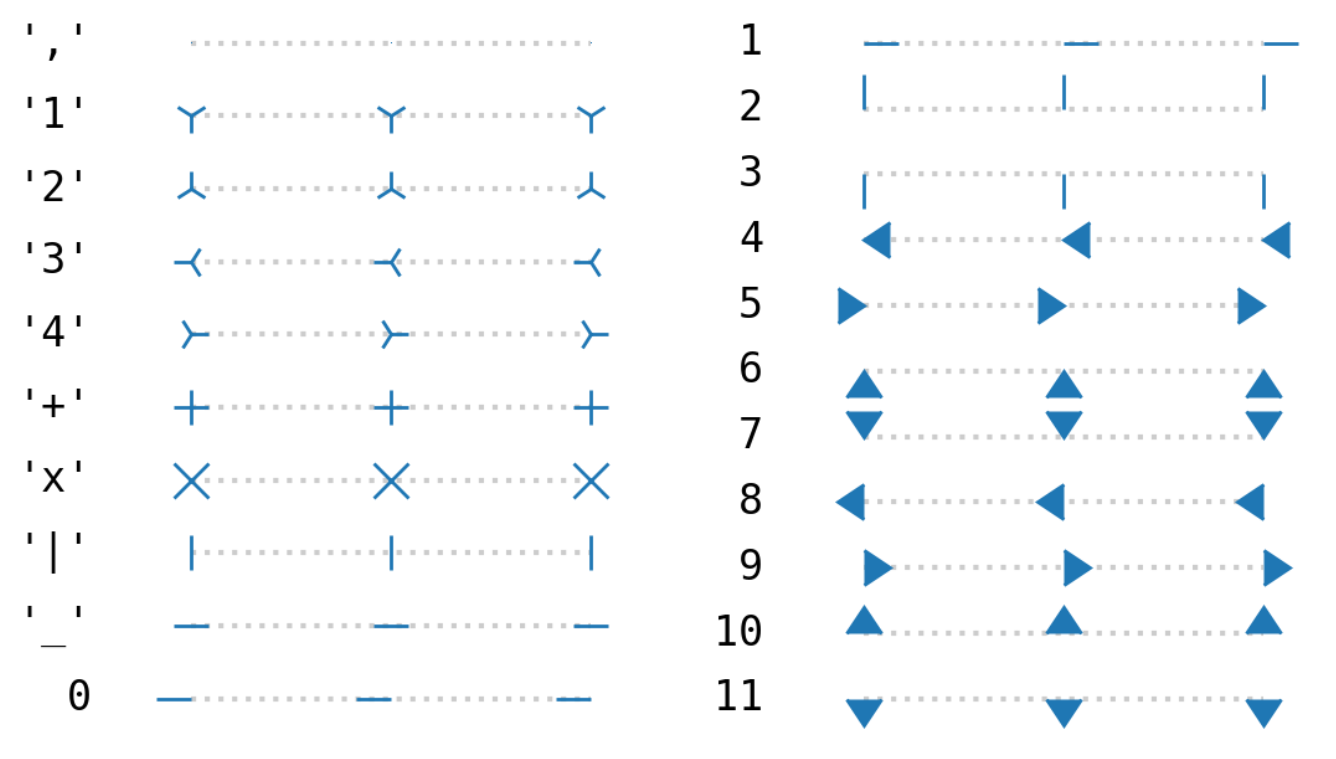
标记(Marker)
matplotlib.markers — Matplotlib 3.7.1 documentation
Marker examples — Matplotlib 3.10.1 documentation
Mapping marker properties to multivariate data — Matplotlib 3.10.1 documentation
| 标记(Marker) |
|---|
| from matplotlib.lines import Line2D
Line2D.markers
"""
{'.': 'point', ',': 'pixel', 'o': 'circle', 'v': 'triangle_down', '^': 'triangle_up',
'<': 'triangle_left', '>': 'triangle_right', '1': 'tri_down', '2': 'tri_up', '3': 'tri_left',
'4': 'tri_right', '8': 'octagon', 's': 'square', 'p': 'pentagon', '*': 'star',
'h': 'hexagon1', 'H': 'hexagon2', '+': 'plus', 'x': 'x', 'D': 'diamond',
'd': 'thin_diamond', '|': 'vline', '_': 'hline', 'P': 'plus_filled', 'X': 'x_filled',
0: 'tickleft', 1: 'tickright', 2: 'tickup', 3: 'tickdown', 4: 'caretleft',
5: 'caretright', 6: 'caretup', 7: 'caretdown', 8: 'caretleftbase', 9: 'caretrightbase',
10: 'caretupbase', 11: 'caretdownbase', 'None': 'nothing', 'none': 'nothing', ' ': 'nothing', '': 'nothing'}
"""
|
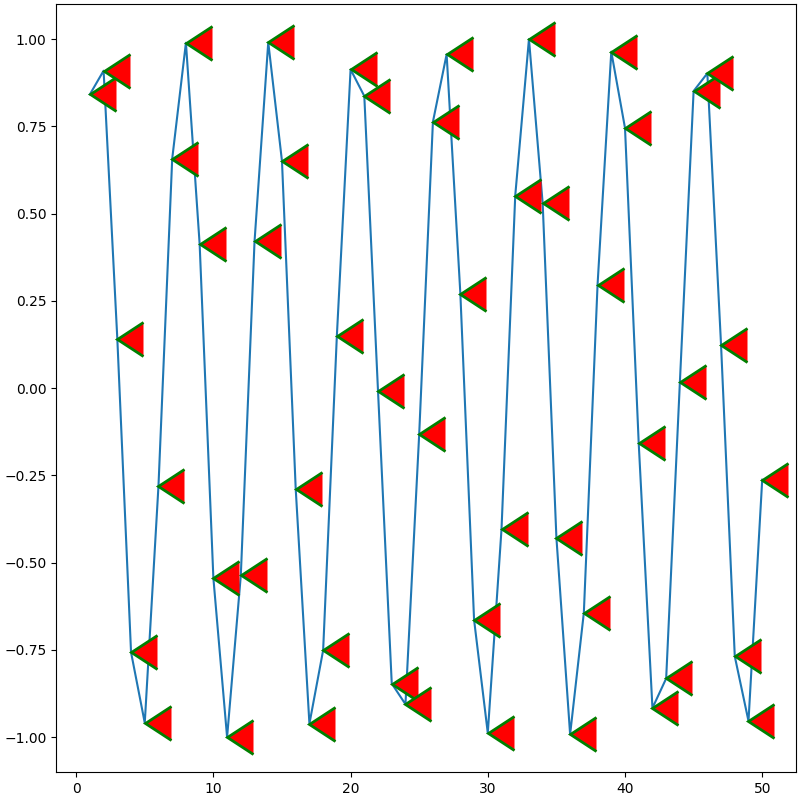
未填充型(Unfilled markers)
Marker reference — Matplotlib 3.10.1 documentation
| 未填充型(Unfilled markers) |
|---|
| fig = plt.figure(figsize=(8, 8), dpi=100, layout="constrained")
ax = fig.add_subplot(1, 1, 1)
ax.plot(x, y,
marker=4, # (1)!
markersize=25, # (2)!
markerfacecolor="red", # (3)!
markeredgecolor="green", # (4)!
markeredgewidth=2, # (5)!
markevery=None, # (6)!
alpha=1
)
plt.show()
|
- 标记类型
- 标记大小(markersize/ms)
- 标记填充色(markerfacecolor/mfc)
- 标记边缘色(markeredgecolor/mec)
- 标记边缘宽度(markeredgewidth/mew)
- 决定每隔几个绘制一个标记点,默认所有
填充型(Filled markers)与填充样式(Fill Style)
Marker reference — Matplotlib 3.10.1 documentation
Marker reference — Matplotlib 3.10.1 documentation
| 填充型(Filled markers) |
|---|
| from matplotlib.lines import Line2D
Line2D.filled_markers
"""
('.', 'o', 'v', '^', '<', '>', '8', 's', 'p', '*', 'h', 'H', 'D', 'd', 'P', 'X')
"""
|
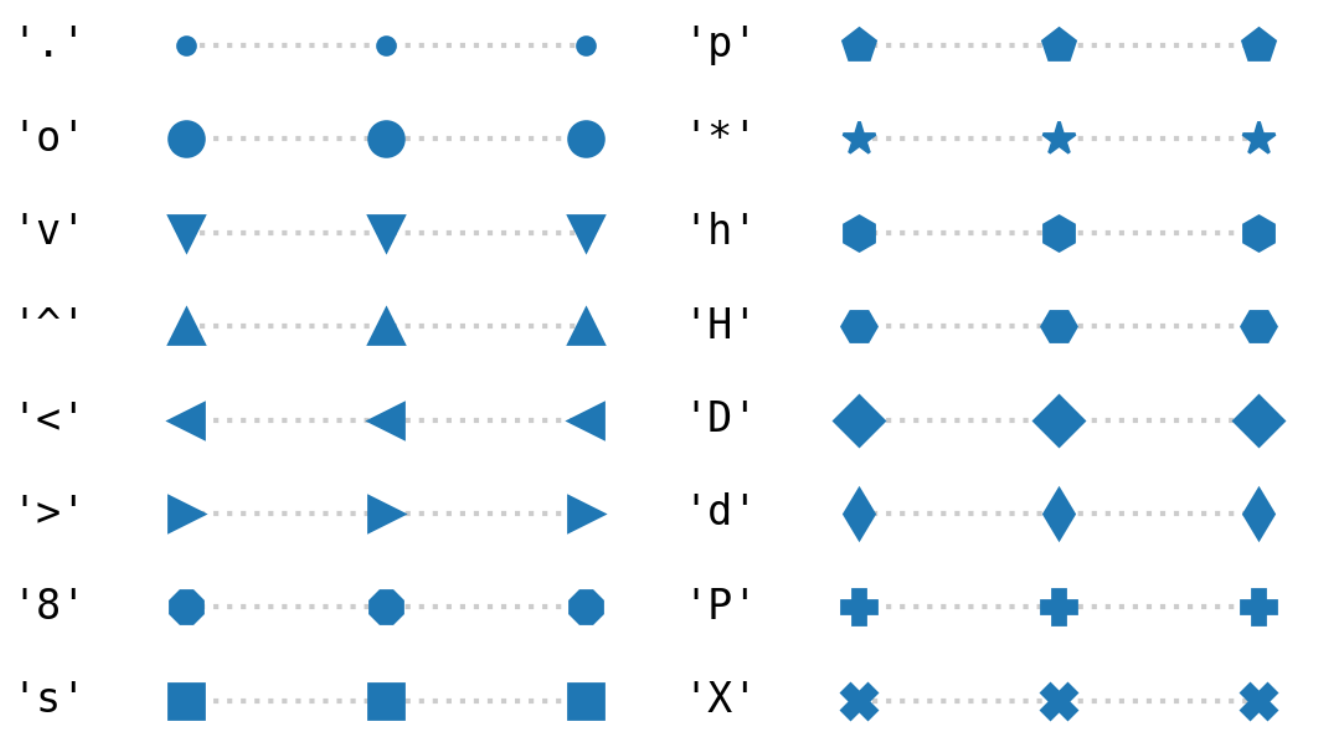
| 填充样式(Fill Style) |
|---|
| from matplotlib.lines import Line2D
Line2D.fillStyles
"""
('full', 'left', 'right', 'bottom', 'top', 'none')
"""
|
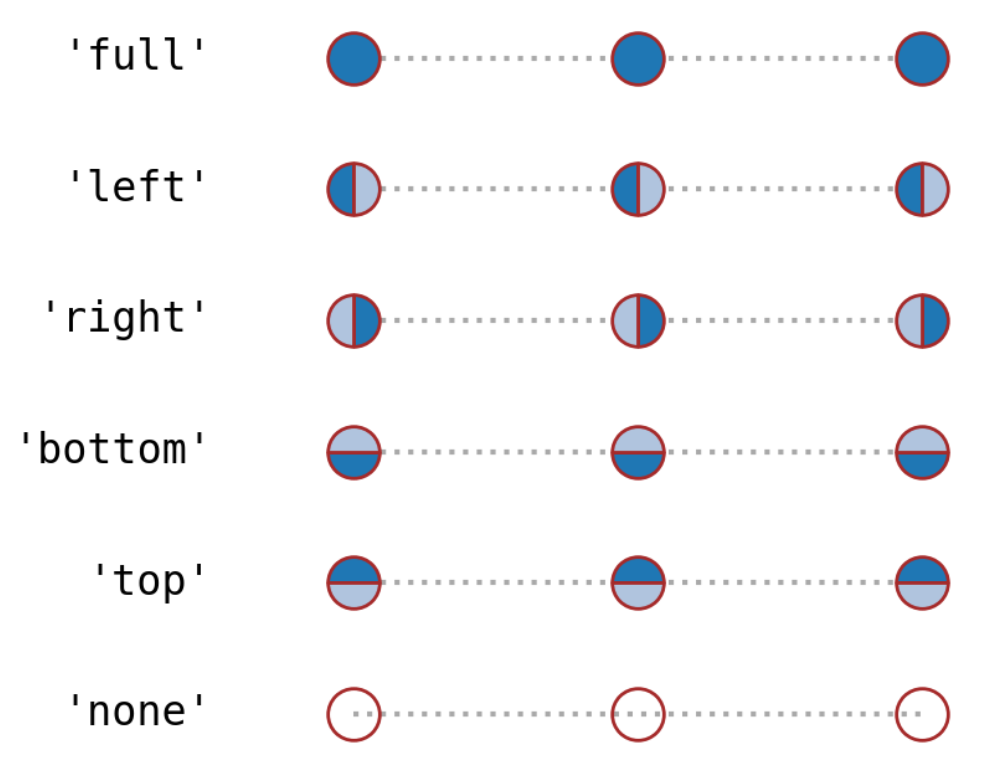
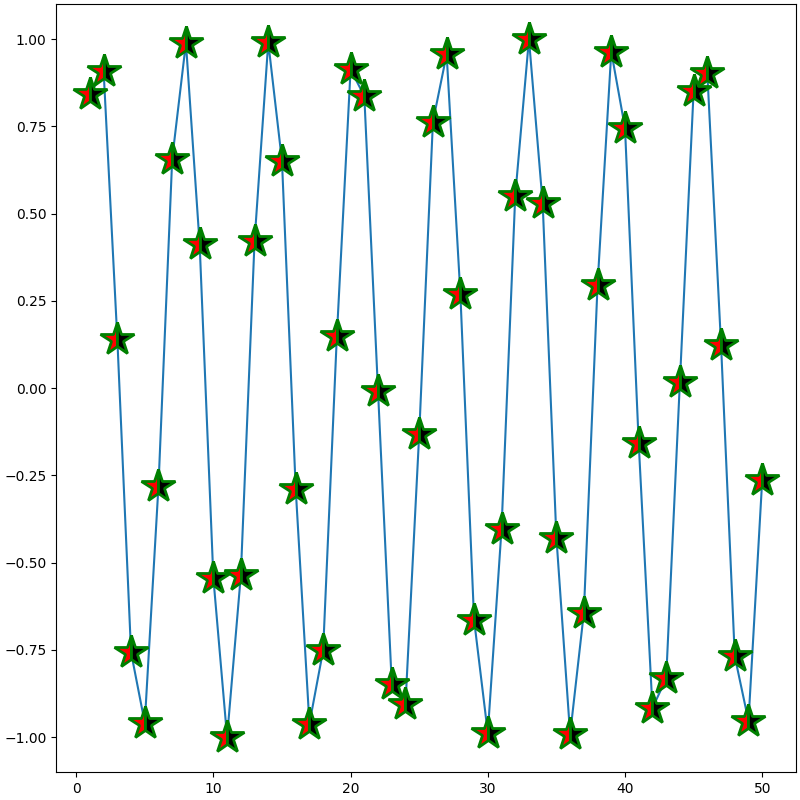
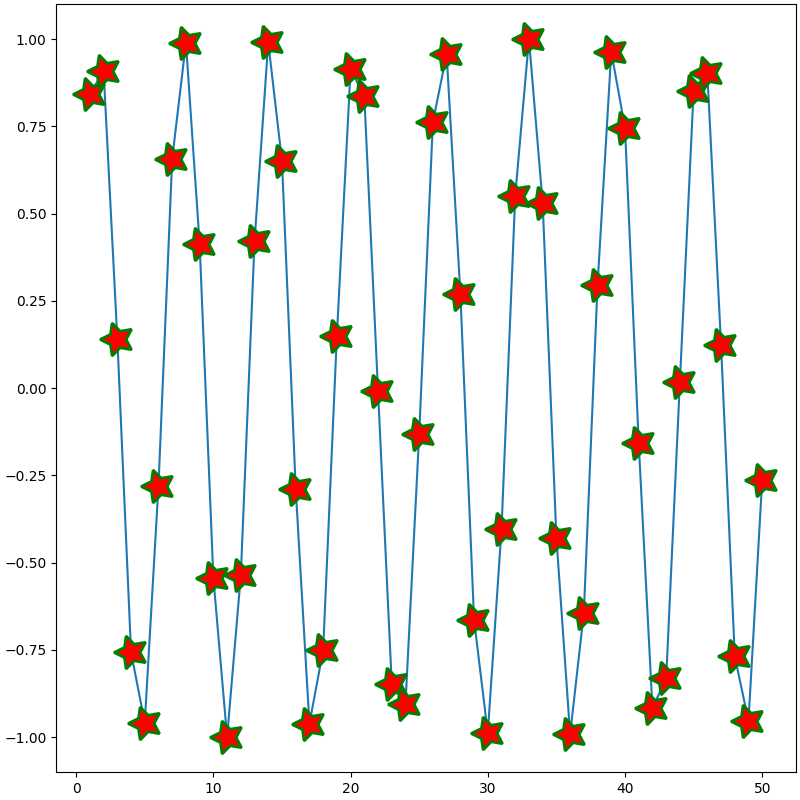
| 填充型(Filled markers)与填充样式(Fill Style) |
|---|
| fig = plt.figure(figsize=(8, 8), dpi=100, layout="constrained")
ax = fig.add_subplot(1, 1, 1)
ax.plot(x, y,
marker="*",
markersize=25,
fillstyle="left", # (1)!
markerfacecolor="red", # (2)!
markerfacecoloralt="black", # (3)!
markeredgecolor="green",
markeredgewidth=2,
markevery=None,
alpha=1
)
plt.show()
|
- 指定markerfacecolor填充侧
- fillstyle指定侧标记填充色(markerfacecolor/mfc)
- 非fillstyle指定侧标记填充色(markerfacecoloralt/mfcalt)
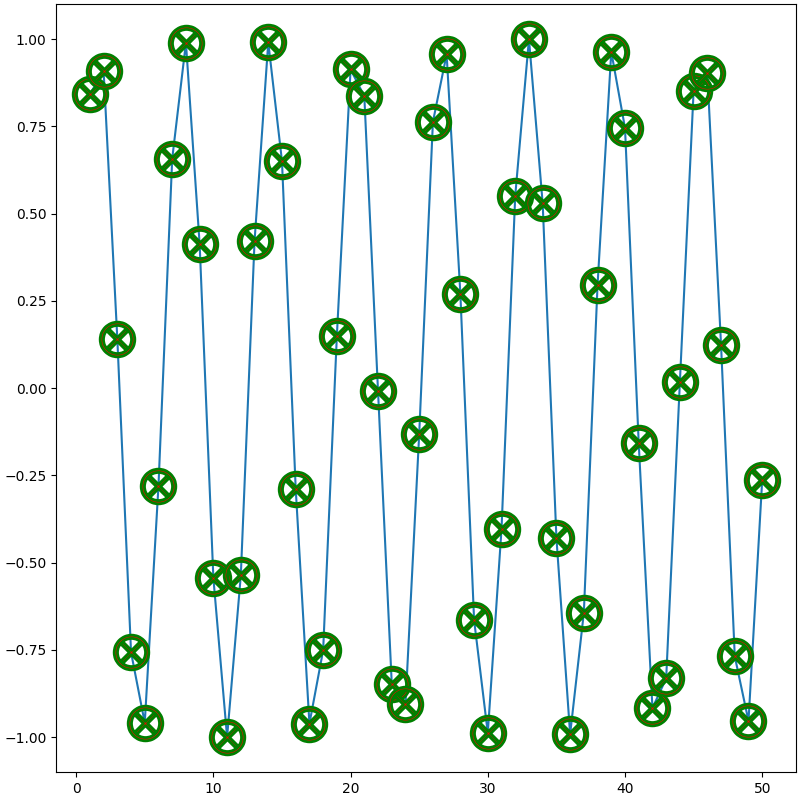
TeX符号创建(Markers created from TeX symbols)
Marker reference — Matplotlib 3.10.1 documentation
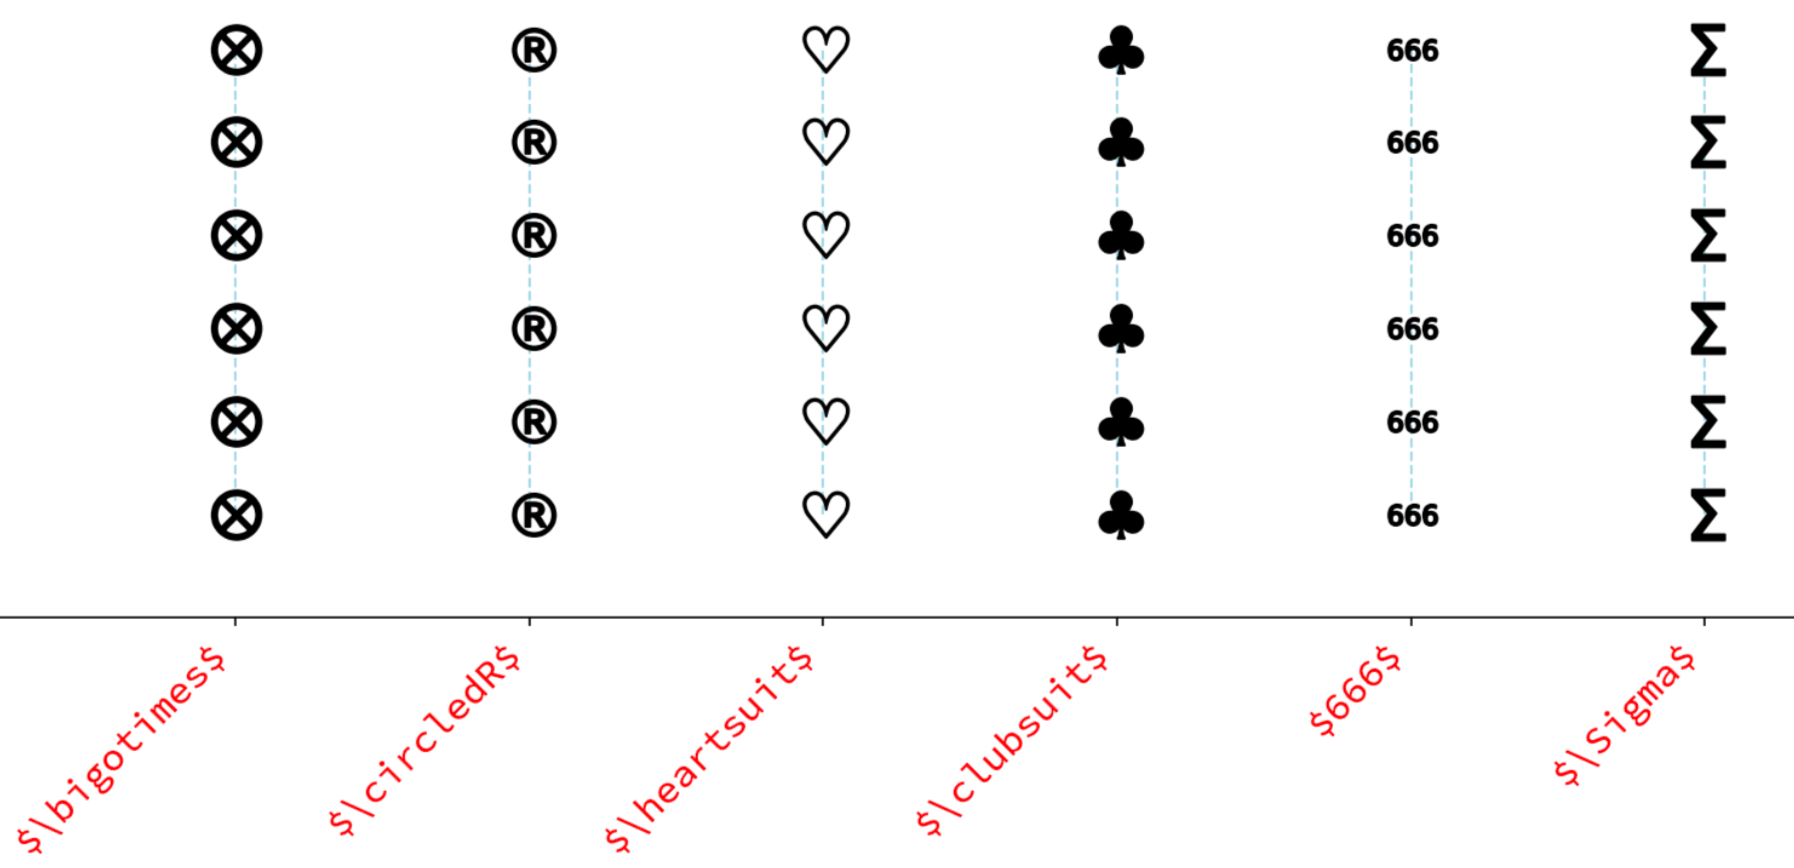
| TeX符号创建(Markers created from TeX symbols) |
|---|
| fig = plt.figure(figsize=(8, 8), dpi=100, layout="constrained")
ax = fig.add_subplot(1, 1, 1)
ax.plot(x, y,
marker=r"$\bigotimes$",
markersize=25,
markerfacecolor="red",
markeredgecolor="green",
markeredgewidth=2,
markevery=None,
alpha=1
)
plt.show()
|
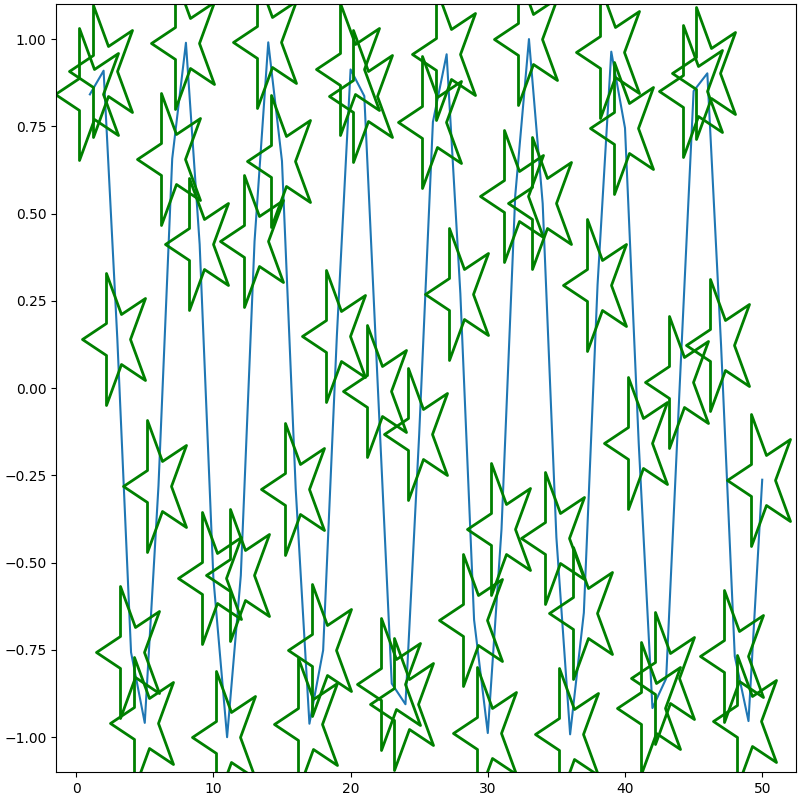
元组型
(numsides, 0, angle):逆时针旋转angle°的正numsides边形
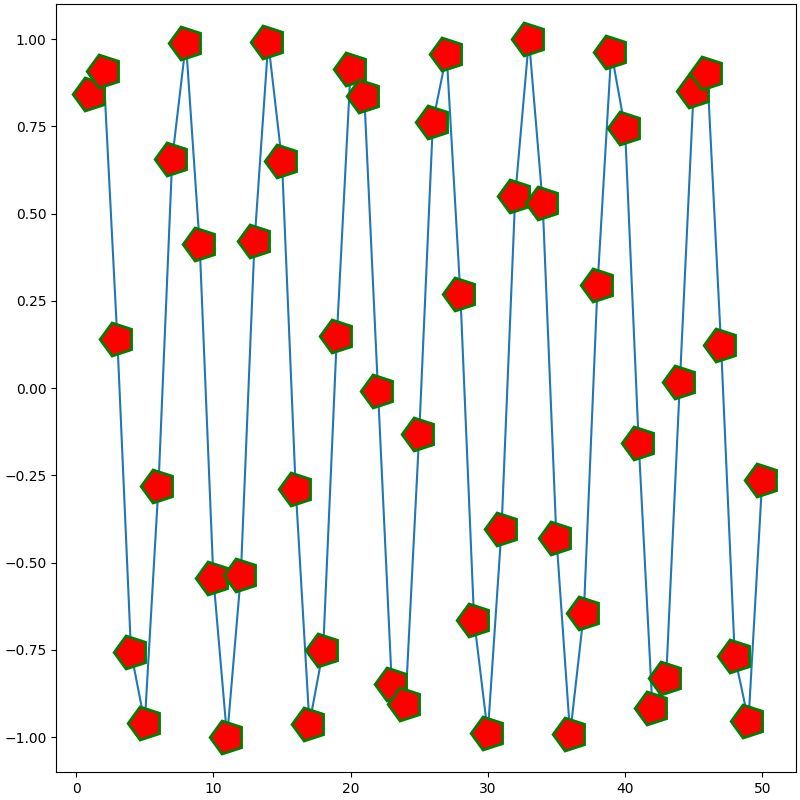
(numsides, 1, angle):逆时针旋转angle°的正numsides角形
(numsides, 2, angle):逆时针旋转angle°的正numsides边星
| 元组型 |
|---|
| fig = plt.figure(figsize=(8, 8), dpi=100, layout="constrained")
ax = fig.add_subplot(1, 1, 1)
ax.plot(x, y,
marker=(5, 0, 90),
markersize=25,
markerfacecolor="red",
markeredgecolor="green",
markeredgewidth=2,
markevery=None,
alpha=1
)
plt.show()
|
Path创建(Markers created from Paths)
Marker reference — Matplotlib 3.10.1 documentation
绘制坐标以原始标记点为原点(0, 0)
-
mpath.Path(vertices, codes=None, closed=False)
-
vertices:绘制的点坐标序列(如[(x1, y1), (x2, y2), ...])或者形状(N, 2)的数组(如[[x1 y1] [x2 y2] ...])。
-
codes:与vertices每个坐标一一对应,表示到该坐标的动作,可选:
-
mpath.Path.STOP = np.uint8(0) = 0:不绘制该坐标且结束绘制
-
mpath.Path.MOVETO = np.uint8(1) = 1:不绘制,仅移动到该坐标。第一个必须是该值。
-
mpath.Path.LINETO = np.uint8(2) = 2:以线段绘制到该坐标
-
mpath.Path.CURVE3 = np.uint8(3) = 3:绘制曲线到该坐标后一个坐标
-
mpath.Path.CURVE4 = np.uint8(4) = 4:绘制曲线到该坐标后两个坐标
-
mpath.Path.CLOSEPOLY = np.uint8(79) = 79:不绘制该坐标,直接前一个坐标绘制线段到第一个坐标以封闭图形
-
closed:是否封闭图形。当codes=None且closed=True时,相当于codes=[1, 2, 2, ..., 79]。
-
mpath.Path.arc(theta1, theta2, n=None, is_wedge=False):绘制从 theta1°到 theta2°(>360°时将减去360°)的单位圆弧。n,略。 is_wedge 指是否绘制弧形半径。
-
mpath.Path.wedge(theta1, theta2, n=None):相当于mpath.Path.arc中 is_wedge=True
-
mpath.Path.circle(center=(0.0, 0.0), radius=1.0, readonly=False):绘制圆心坐标为 center,半径为 radius 的圆。readonly,略。
-
mpath.Path.unit_circle():绘制单位圆
-
mpath.Path.unit_circle_righthalf():绘制单位圆右侧半
-
mpath.Path.unit_rectangle():绘制单位矩形(正方形)
-
mpath.Path.unit_regular_asterisk(numVertices):绘制单位正 numVertices 边星
-
mpath.Path.unit_regular_polygon(numVertices):绘制单位正 numVertices 边形
-
mpath.Path.unit_regular_star(numVertices, innerCircle=0.5):绘制单位正 numVertices 角星。innerCircle,略
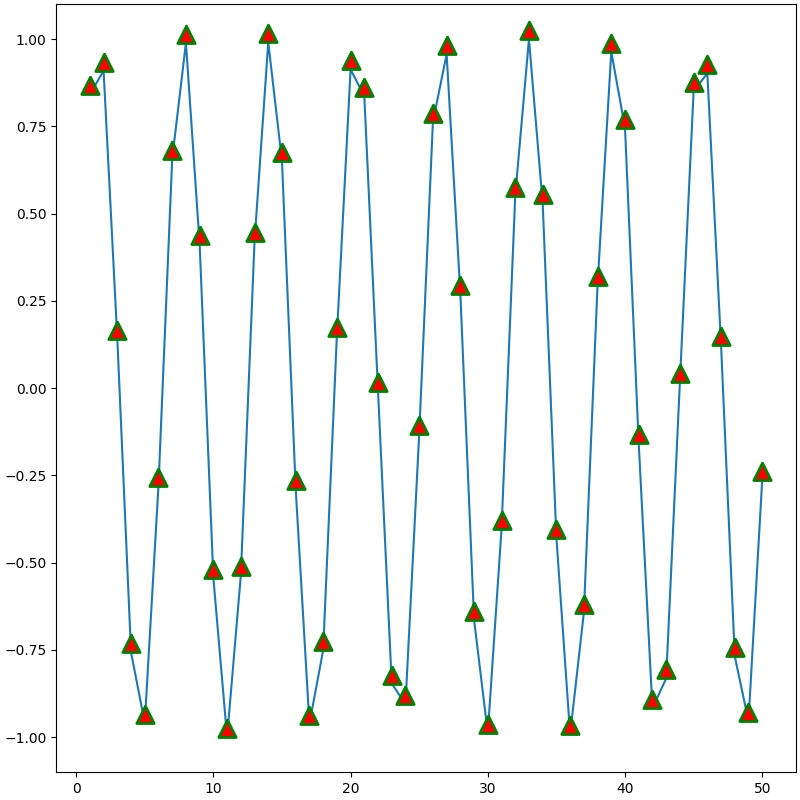
| 基类 |
|---|
| import matplotlib.path as mpath
fig = plt.figure(figsize=(8, 8), dpi=100, layout="constrained")
ax = fig.add_subplot(1, 1, 1)
vertices = [(-2, 0), (0, 4), (2, 0), (0, -4)]
codes= [1, 2, 2, 79]
ax.plot(x, y,
marker=mpath.Path(vertices, codes=codes, closed=False),
markersize=25,
markerfacecolor="red",
markeredgecolor="green",
markeredgewidth=2,
markevery=None,
alpha=1
)
plt.show()
|
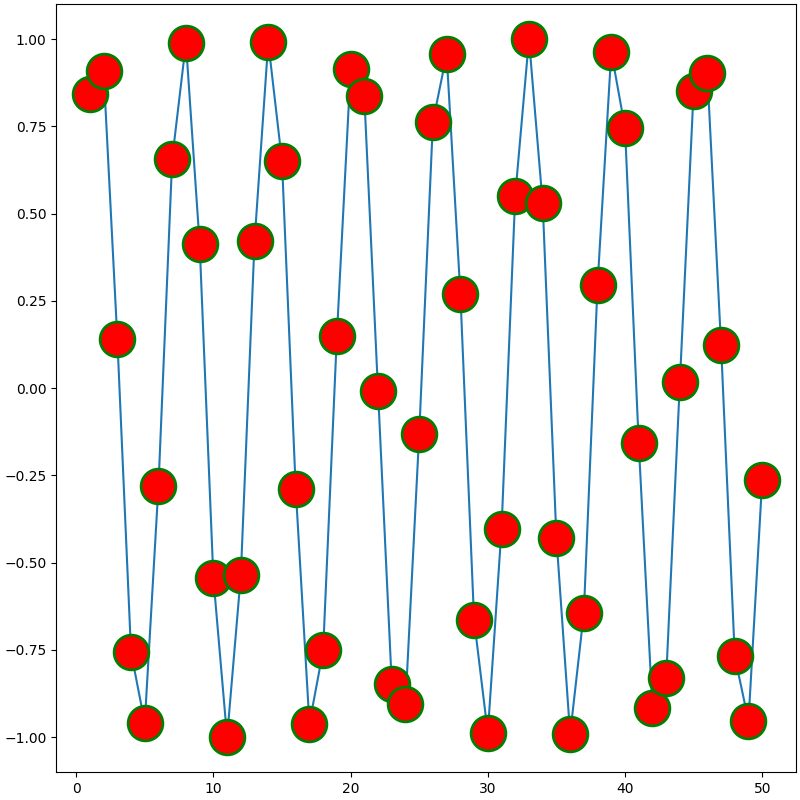
| 子类 |
|---|
| import matplotlib.path as mpath
fig = plt.figure(figsize=(8, 8), dpi=100, layout="constrained")
ax = fig.add_subplot(1, 1, 1)
ax.plot(x, y,
marker=mpath.Path.unit_circle(),
markersize=25,
markerfacecolor="red",
markeredgecolor="green",
markeredgewidth=2,
markevery=None,
alpha=1
)
plt.show()
|
MarkerStyle创建
Marker reference — Matplotlib 3.10.1 documentation
Marker reference — Matplotlib 3.10.1 documentation
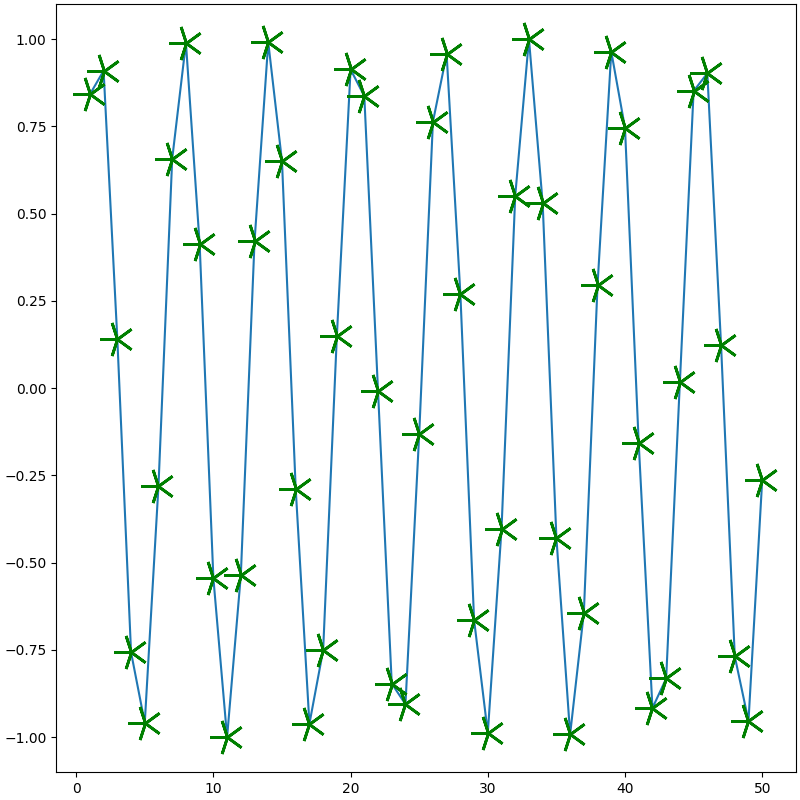
| MarkerStyle创建 |
|---|
| from matplotlib.markers import MarkerStyle
fig = plt.figure(figsize=(8, 8), dpi=100, layout="constrained")
ax = fig.add_subplot(1, 1, 1)
marker = MarkerStyle(marker="1",
fillstyle='none',
capstyle='round',
joinstyle='miter')
marker = marker.rotated(deg=90, # (1)!
rad=None) # (2)!
marker = marker.scaled(sx=2, # (3)!
sy=4) # (4)!
ax.plot(x, y,
marker=marker,
markersize=25,
markerfacecolor="red",
markeredgecolor="green",
markeredgewidth=2,
markevery=None,
alpha=1
)
plt.show()
|
- 逆时针旋转(度数)
- 逆时针旋转(弧度)
- x轴上的缩放。必须指定
- y轴上的缩放。若未指定,x轴和y轴均按sx缩放
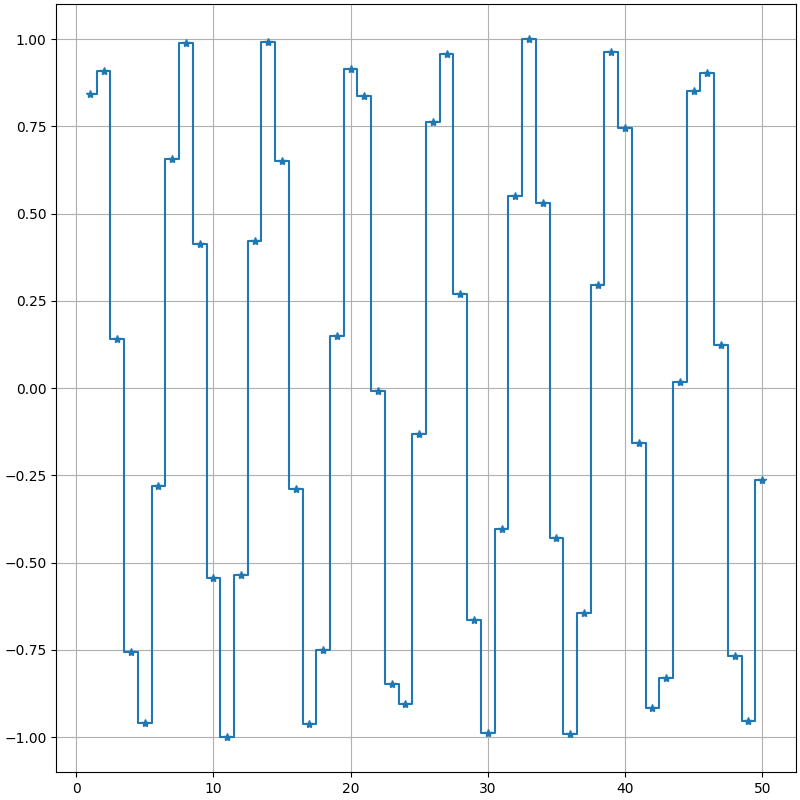
绘制样式(Draw Style)
Step Demo — Matplotlib 3.10.1 documentation
matplotlib.pyplot.step — Matplotlib 3.10.1 documentation
matplotlib.axes.Axes.step — Matplotlib 3.10.1 documentation
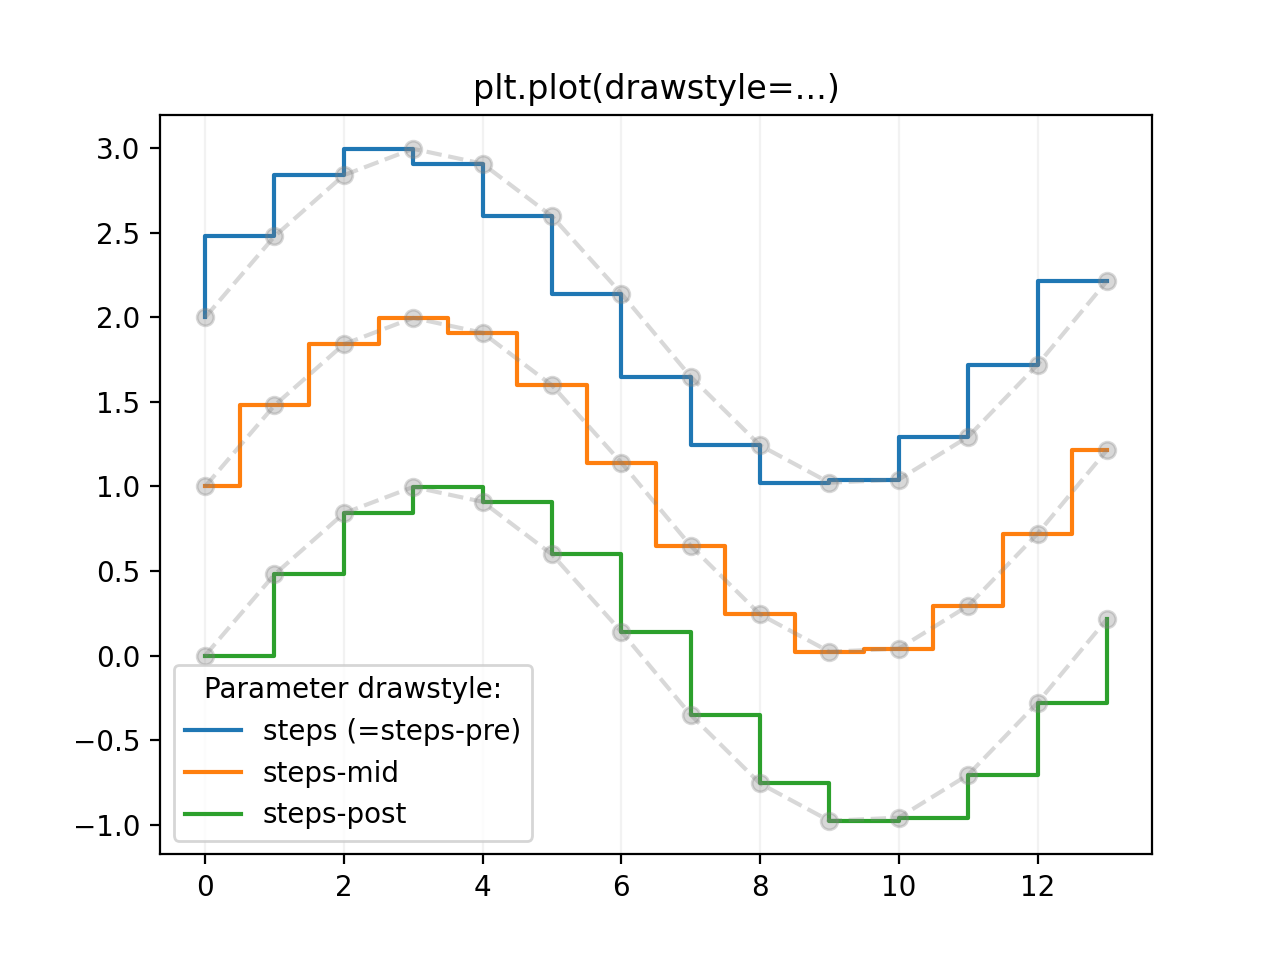
step函数是对plot(drawstyle=...)的封装,通过where参数来指定'pre'、'mid'、'post'
| 绘制样式(Draw Style) |
|---|
| fig = plt.figure(figsize=(8, 8), dpi=100, layout="constrained")
ax = fig.add_subplot(1, 1, 1)
ax.plot(x, y,
linestyle="-",
marker="*",
drawstyle="steps-mid" # (1)!
)
# ax.step(x, y,
# linestyle="-",
# marker="*",
# where="mid"
# )
ax.grid()
plt.show()
|
- drawstyle/ds
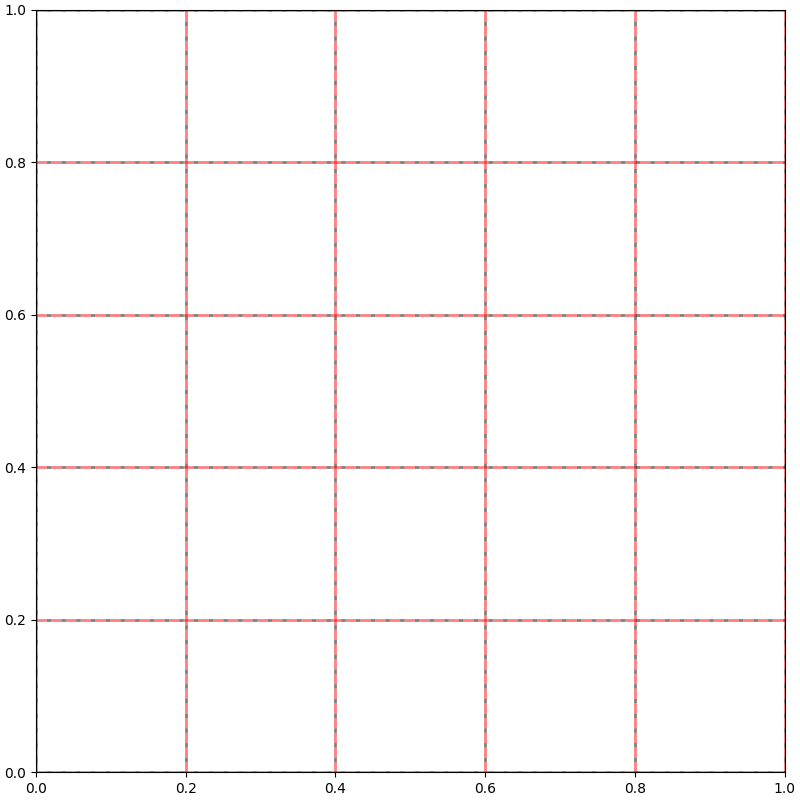
网格线(Grid)
matplotlib.axes.Axes.grid — Matplotlib 3.10.1 documentation
matplotlib.pyplot.grid — Matplotlib 3.10.1 documentation
| 网格线(Grid) |
|---|
| fig = plt.figure(figsize=(8, 8), dpi=100, layout="constrained")
ax = fig.add_subplot(1, 1, 1)
ax.grid(visible=True, # (1)!
which="both", # (2)!
axis="both", # (3)!
linestyle="--",
linewidth=2,
color="red",
gapcolor="black",
alpha=0.5,
)
plt.show()
|
- 网格线是否可见
- 绘制在主刻度还是副刻度, 可选:
- 'major'
- 'minor'
- 'both'
- 绘制哪个轴的, 可选:
- 'both'
- 'x'
- 'y'
参考线(Line)
matplotlib.axes.Axes.axhline — Matplotlib 3.10.1 documentation
matplotlib.pyplot.axhline — Matplotlib 3.10.1 documentation
matplotlib.axes.Axes.axvline — Matplotlib 3.10.1 documentation
matplotlib.pyplot.axvline — Matplotlib 3.10.1 documentation
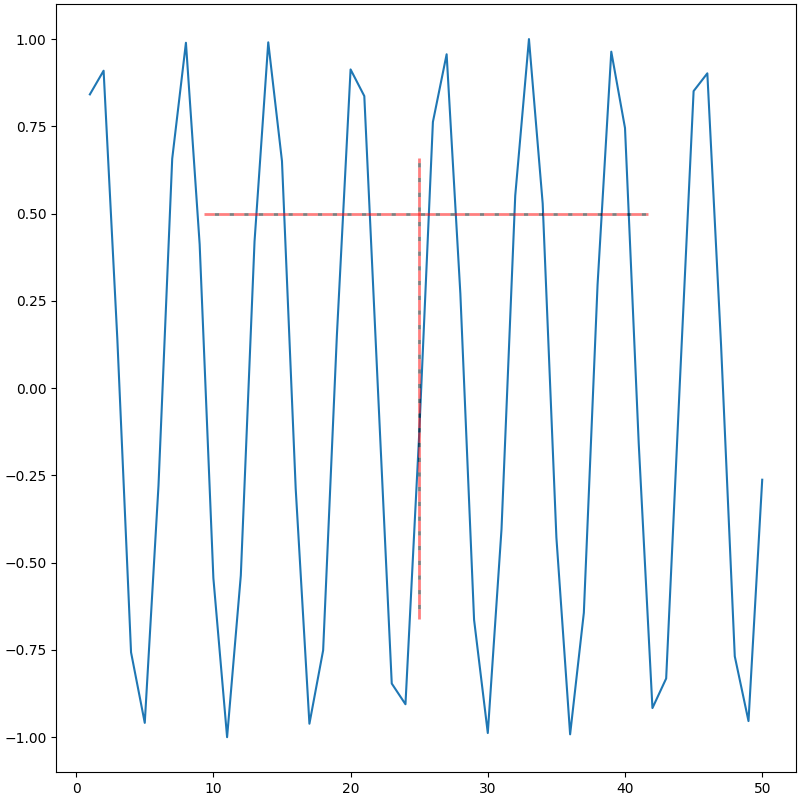
| axhline与axvline |
|---|
| fig = plt.figure(figsize=(8, 8), dpi=100, layout="constrained")
ax = fig.add_subplot(1, 1, 1)
ax.plot(x, y)
ax.axhline(y=0.5, # (1)!
xmin=0.2, # (2)!
xmax=0.8, # (3)!
linestyle="--",
linewidth=2,
color="red",
gapcolor="black",
alpha=0.5,
)
ax.axvline(x=25, # (4)!
ymin=0.2, # (5)!
ymax=0.8, # (6)!
linestyle="--",
linewidth=2,
color="red",
gapcolor="black",
alpha=0.5,
)
plt.show()
|
- 数据坐标系统
- Axes坐标系统
- Axes坐标系统
- 数据坐标系统
- Axes坐标系统
- Axes坐标系统
matplotlib.axes.Axes.hlines — Matplotlib 3.10.1 documentation
matplotlib.pyplot.hlines — Matplotlib 3.10.1 documentation
matplotlib.axes.Axes.vlines — Matplotlib 3.10.1 documentation
matplotlib.pyplot.vlines — Matplotlib 3.10.1 documentation
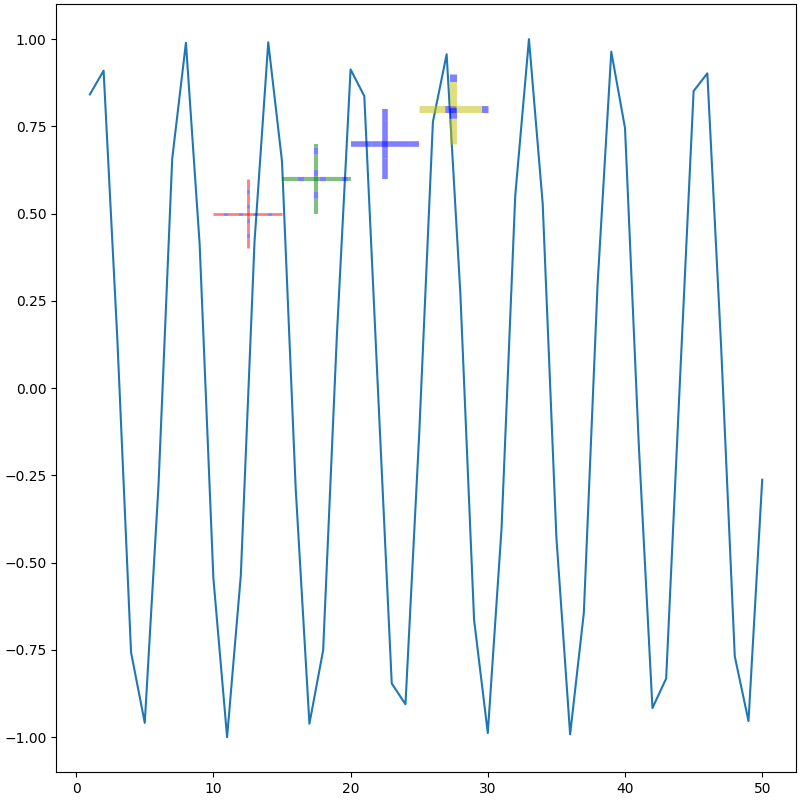
| hlines与vlines |
|---|
| fig = plt.figure(figsize=(8, 8), dpi=100, layout="constrained")
ax = fig.add_subplot(1, 1, 1)
ax.plot(x, y)
ax.hlines(y=[0.5, 0.6, 0.7, 0.8], # (1)!
xmin=[10, 15, 20, 25], # (2)!
xmax=[15, 20, 25, 30], # (3)!
linestyles="--",
linewidths=[2, 3, 4, 5],
colors=["r", "g", "b", "y"],
gapcolor="b",
alpha=0.5,
)
ax.vlines(x=[12.5, 17.5, 22.5, 27.5], # (4)!
ymin=[0.4, 0.5, 0.6, 0.7], # (5)!
ymax=[0.6, 0.7, 0.8, 0.9], # (6)!
linestyles="--",
linewidths=[2, 3, 4, 5],
colors=["r", "g", "b", "y"],
gapcolor="b",
alpha=0.5,
)
plt.show()
|
- 数据坐标系统
- 数据坐标系统
- 数据坐标系统
- 数据坐标系统
- 数据坐标系统
- 数据坐标系统