文本(Text)、注释(Annotate)、标题(Title)
Text, labels and annotations — Matplotlib 3.10.1 documentation
Properties of Mark objects — seaborn 0.13.2 documentation
属性
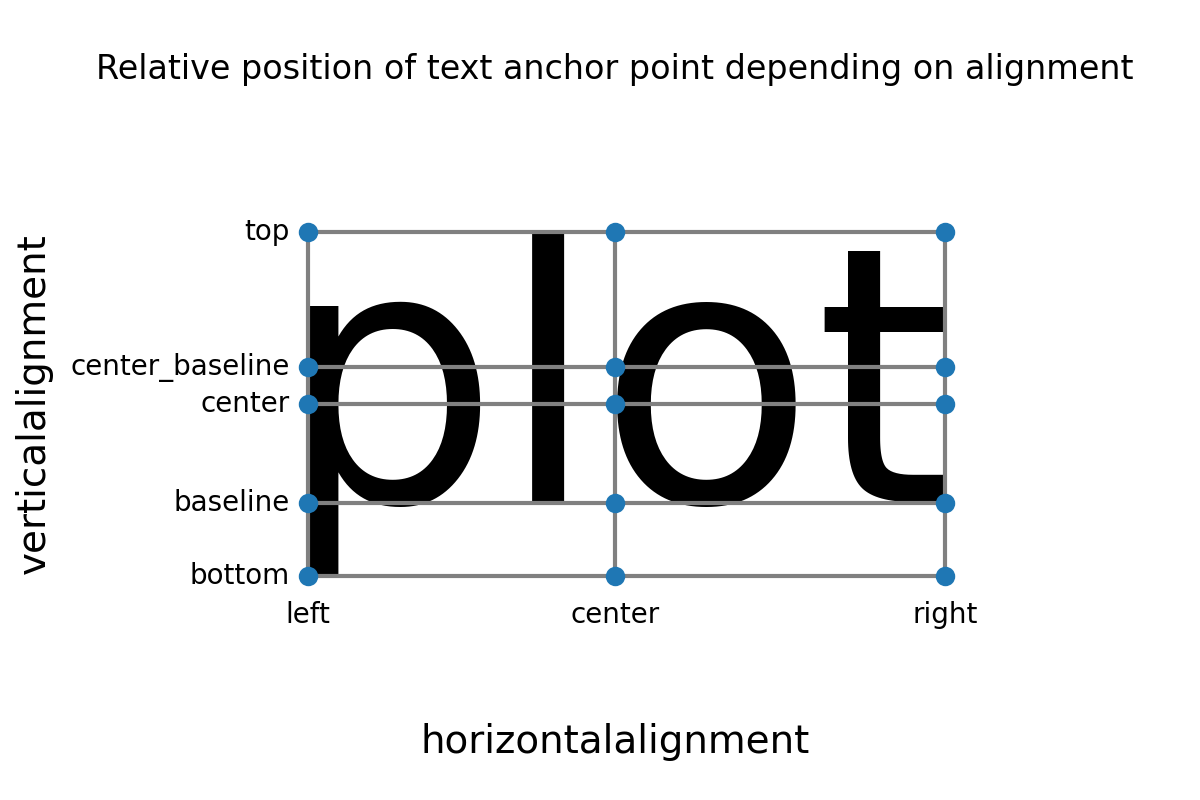
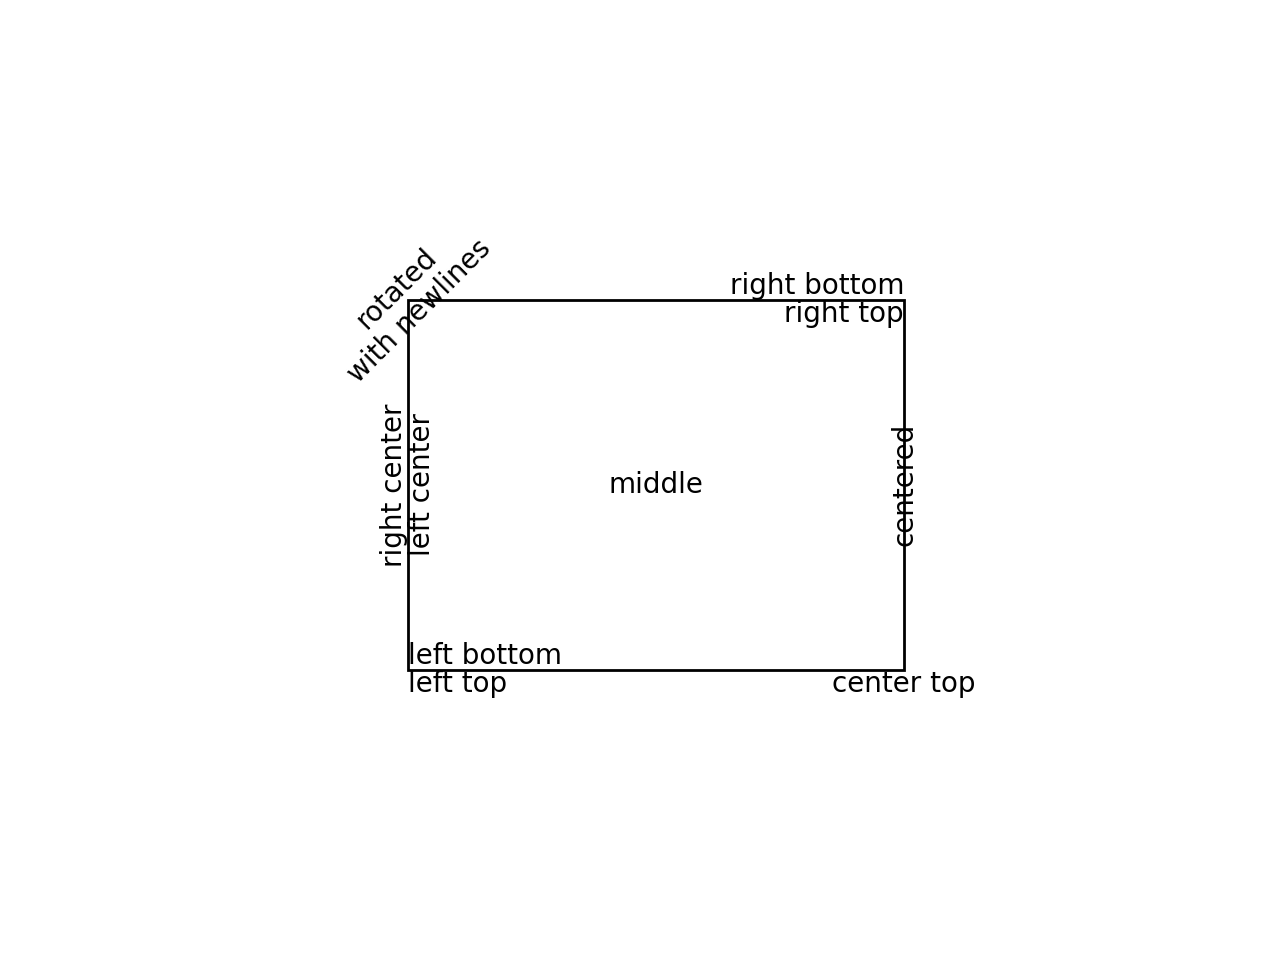
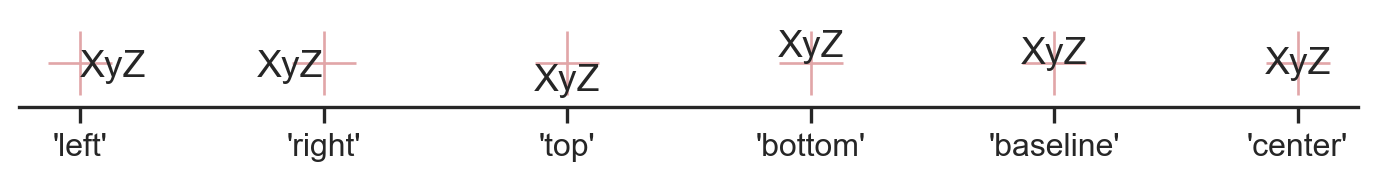
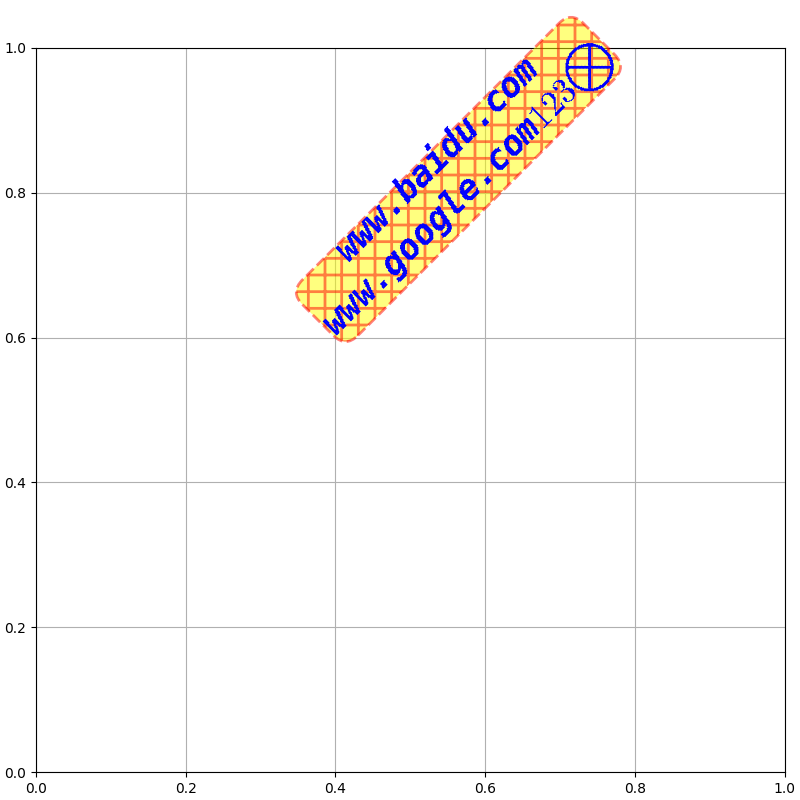
文本(Text)
matplotlib.text — Matplotlib 3.10.1 documentation
matplotlib.axes.Axes.text — Matplotlib 3.10.1 documentation
matplotlib.figure.Figure.text — Matplotlib 3.10.1 documentation
matplotlib.pyplot.text — Matplotlib 3.10.1 documentation
Text — Matplotlib 3.10.1 documentation
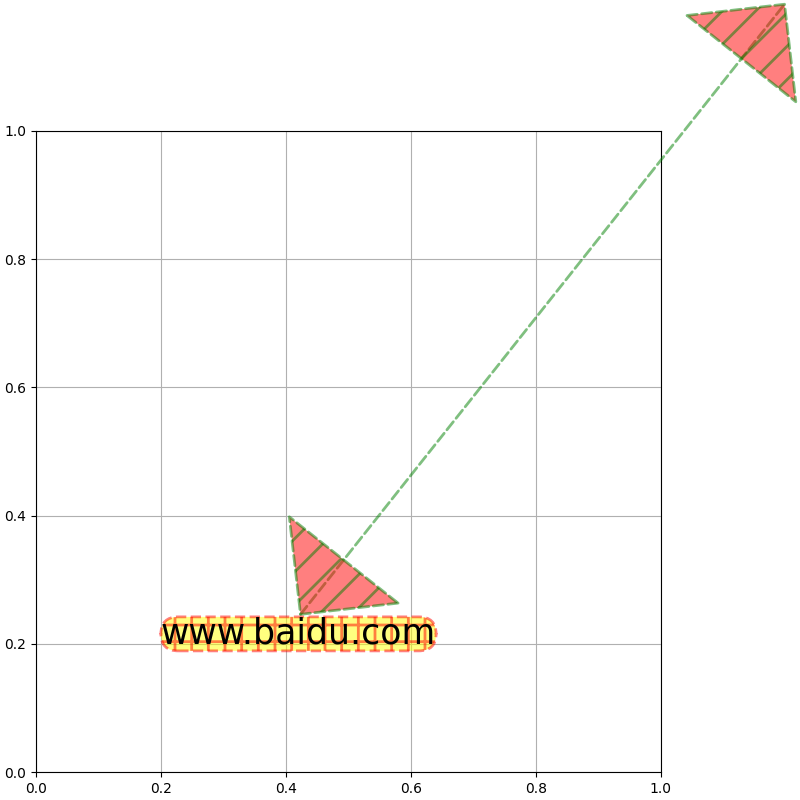
注释(Annotate)
matplotlib.text — Matplotlib 3.10.1 documentation
matplotlib.axes.Axes.annotate — Matplotlib 3.10.1 documentation
matplotlib.pyplot.annotate — Matplotlib 3.10.1 documentation
Annotations — Matplotlib 3.10.1 documentation
Annotation arrow style reference — Matplotlib 3.10.1 documentation
| 坐标系统字符串 | 含义 |
|---|---|
'figure points' |
从Figure左下角开始的点数 |
'figure pixels' |
从Figure左下角开始的像素数 |
'figure fraction' |
从Figure左下角开始的比例 |
'subfigure points' |
从subFigure左下角开始的点数 |
'subfigure pixels' |
从subFigure左下角开始的像素数 |
'subfigure fraction' |
从subFigure左下角开始的比例 |
'axes points' |
从Axes左下角开始的点数 |
'axes pixels' |
从Axes左下角开始的像素数 |
'axes fraction' |
从Axes左下角开始的比例 |
'data' |
使用数据坐标系统 |
'polar' |
使用极坐标系统 |
'offset points' |
从xy参数偏移的点数(仅用于textcoords参数) |
'offset pixels' |
从xy参数偏移的像素数(仅用于textcoords参数) |
'offset fontsize' |
相对于字体大小,从xy参数偏移的量(仅用于textcoords参数) |
| Simple arrow | 含义 |
|---|---|
width |
箭身宽 |
headwidth |
箭头宽(以点为单位) |
headlength |
箭头长(以点为单位) |
shrink |
箭两端收缩的总长度比例 |
| ? | 其它任何 FancyArrowPatch属性 |
| Fancy arrow | 含义 |
|---|---|
relpos |
确切起始位置(相对于文本框的坐标元组),默认(0.5, 0.5),即文本框中心 |
arrowstyle |
箭样式 |
connectionstyle |
连接样式 |
shrinkA |
起始收缩点数(默认2) |
shrinkB |
末尾收缩点数(默认2) |
patchA |
默认text的bounding box |
patchB |
默认None |
mutation_scale |
/ |
mutation_aspect |
/ |
| ? | 其它任何 FancyArrowPatch属性 |
标题(Title)
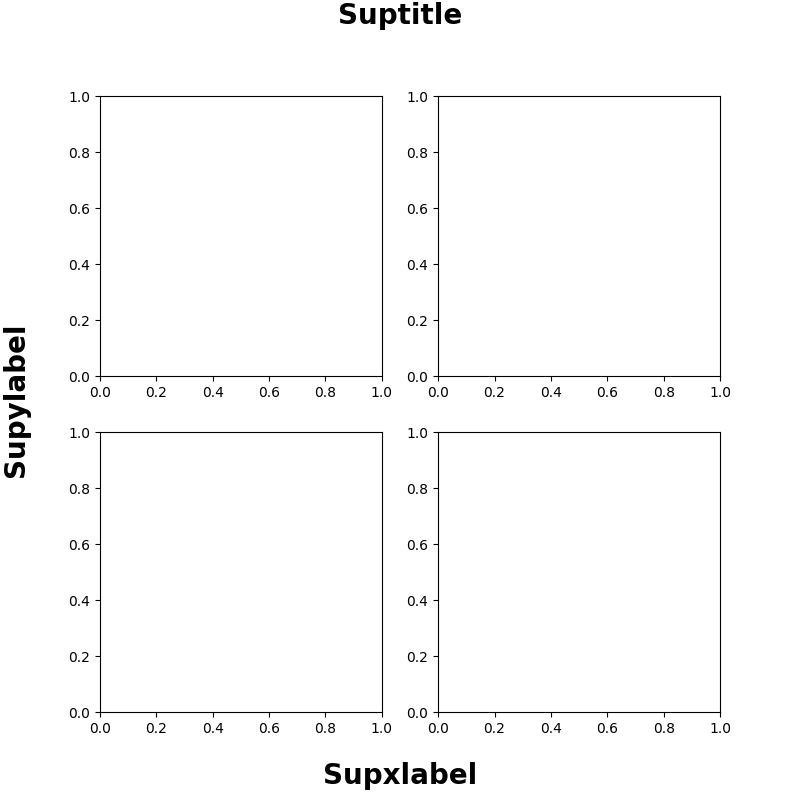
Figure标题(suptitle、supxlabel、supylabel)
matplotlib.figure.Figure.suptitle — Matplotlib 3.10.1 documentation
matplotlib.pyplot.suptitle — Matplotlib 3.10.1 documentation
matplotlib.figure.Figure.supxlabel — Matplotlib 3.10.1 documentation
matplotlib.figure.Figure.supylabel — Matplotlib 3.10.1 documentation
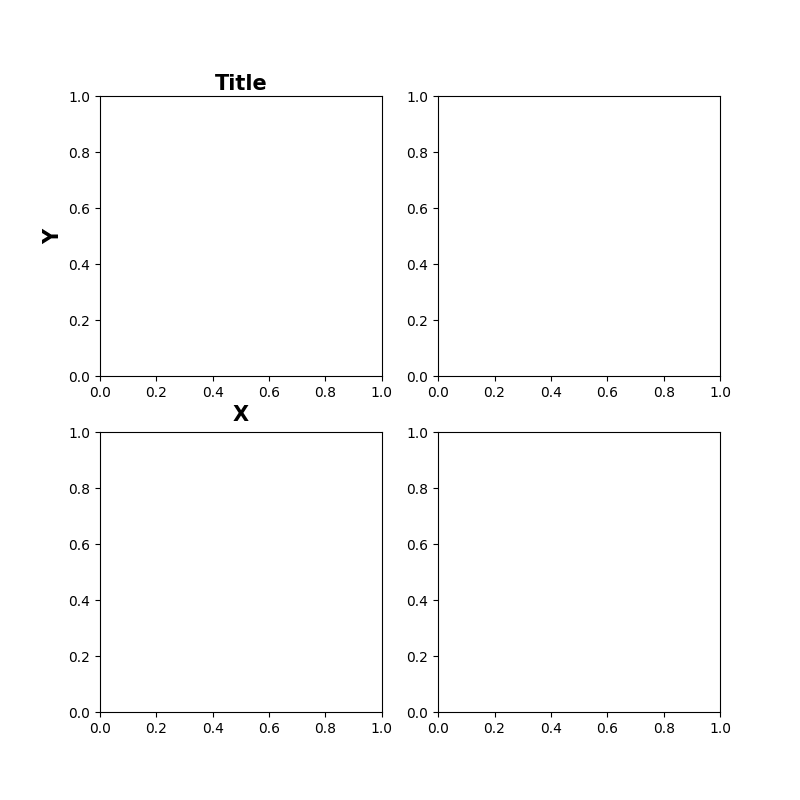
Axes标题(set_title、set_xlabel、set_ylabel)
matplotlib.axes.Axes.set_title — Matplotlib 3.10.1 documentation
matplotlib.pyplot.title — Matplotlib 3.10.1 documentation
matplotlib.axes.Axes.set_xlabel — Matplotlib 3.10.1 documentation
matplotlib.pyplot.xlabel — Matplotlib 3.10.1 documentation
matplotlib.axes.Axes.set_ylabel — Matplotlib 3.10.1 documentation
matplotlib.pyplot.ylabel — Matplotlib 3.10.1 documentation
自动文本调整(adjustText)
Welcome to the documentation for adjustText! — adjustText documentation